From Ketan Parekh scam to Covid: What 25 years of history reveals about ideal asset allocation during market downturns
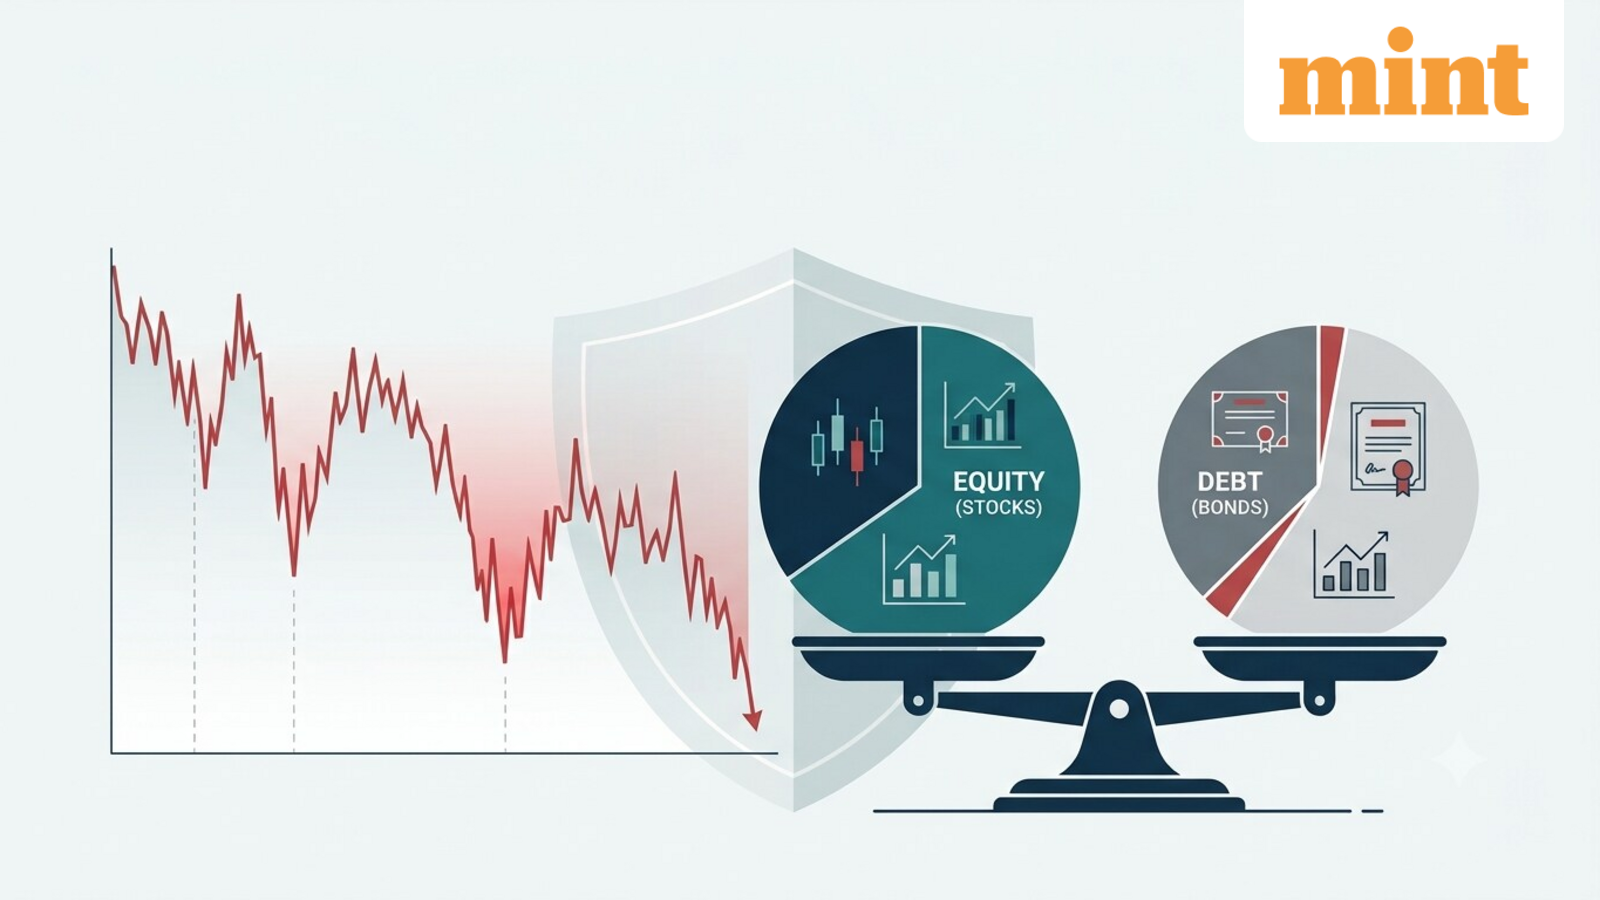
Every market cycle brings periods of sharp declines that test investors’ patience. From the Ketan Parekh scam in 2000 to the Dotcom crash, the Global Financial Crisis, Covid-19, and the recent US-Iran conflict, equity markets have witnessed several deep corrections.
While market falls are unavoidable, historical data shows that the extent of portfolio losses has varied significantly depending on the allocation between equity and debt.
Some recoveries took years
The data covers nine major market corrections since 2000, tracking the extent of the fall, the duration of the decline, and the time taken for the Nifty 50 Total Return Index (TRI) to regain its previous peak.
The Ketan Parekh scam and the Dotcom crash resulted in drawdowns of around 35-39%, with recoveries taking 1,389 days and 923 days, respectively.
The 2004 Lok Sabha election also triggered a market correction after the NDA defeat. The Nifty 50 TRI fell 30% over 124 days before recovering to its previous peak in 321 days.
The Global Financial Crisis of 2008 was the deepest correction in the period, with the index declining 60% over 293 days. The recovery stretched to nearly 1,000 days.
By comparison, the Covid-19 crash unfolded much faster. Markets dropped 37% in just 32 days, although the recovery was considerably quicker at 259 days.
The latest correction linked to the US-Iran conflict saw a decline of 15% over 90 days, with the market yet to recover to its previous peak.
Portfolio allocation changed the depth of losses
The data also compares how different portfolio allocations would have behaved during each market correction.
Portfolios with a higher allocation to debt recorded smaller declines than portfolios invested entirely in equities.
For example, during the Global Financial Crisis, a 100% equity portfolio mirrored the market’s 60% decline. In comparison, a portfolio comprising 65% equity and 35% debt would have declined 41%, while a 50:50 equity-debt mix would have fallen 31%. A portfolio with 25% equity and 75% debt would have recorded a 14% decline.
A similar pattern appears across other market events. During the Covid-19 correction, drawdown ranged from 37% in a fully equity portfolio to 24%, 19%, and 9% as debt allocation increased.
The same trend is visible during the Ketan Parekh scam, Dotcom crash, the US debt ceiling crisis, China slowdown, and the FII sell-off.
A consistent historical pattern
Although each market correction was triggered by different economic or geopolitical events, the historical data shows a similar relationship between portfolio composition and drawdowns.
Portfolios with a larger debt component generally experienced lower declines during periods of market stress, while portfolios fully invested in equities reflected the full extent of the market correction.
While declines often occur within weeks or months, markets can take several months or even years to recover.
Disclaimer: This is purely for educational/ informational purposes and should not be taken as any sort of investment advice. Always consult a SEBI-registered advisor before making any investment decisions.