Vacation Homes Selling Faster Than a Year Ago as Luxury Market Prices Cool

In Nantucket, MA, over 50% of the housing inventory is designated for holidays, vacation or seasonal purposes, representing the highest concentration within any luxury market in the nation. This degree of scarcity is influencing the pricing strategies of vacation-oriented luxury markets, diverging from the national trend, according to the Realtor.com Luxury Housing Report for June 2026.
On a national scale, the entry threshold for luxury properties decreased to $1,277,907 in June, reflecting a 1.7% decline compared to the previous year and marking the 27th consecutive month of annual decreases. The rate of decline has accelerated from May’s 1.4% drop, deviating from a recent pattern of diminishing annual losses. Nevertheless, luxury homes continued to sell at a quicker pace than they did a year prior across all price segments: the top 10% of listings sold in a median of 63 days, which is two days faster than in June 2025, while the top 1% saw an improvement of three days over the same timeframe.
“While the national luxury price is cooling somewhat, in vacation towns like Nantucket, MA, and Breckenridge, CO, that doesn’t matter much,” said Anthony Smith, Senior Economist at Realtor.com. “Buyers there aren’t paying for square footage. They’re paying for a place that can’t be reproduced anywhere else. You can’t manufacture more coastline or more mountain. That’s a different kind of market, built on a different kind of scarcity.”
Top 10 Most Expensive Metro Luxury Markets:
| Rank | Area | 10% Most Expensive Listings Start at: | 10% Most Expensive MoM | 10% Most Expensive YoY | Average Annual Million-Dollar Listings Count | Multiple to National Luxury Median |
| 1 | Bridgeport-Stamford-Danbury, CT | $4,199,550 | 0.0% | -4.4% | 527 | 3.3 |
| 2 | Los Angeles-Long Beach-Anaheim, CA | $4,100,059 | -2.2% | -5.8% | 9253 | 3.2 |
| 3 | Kahului-Wailuku, Hawaii | $3,942,500 | -0.2% | -0.4% | 713 | 3.1 |
| 4 | Naples-Marco Island, FL | $3,733,572 | -0.3% | 4.1% | 2189 | 2.9 |
| 5 | San Jose-Sunnyvale-Santa Clara, CA | $3,249,087 | -6.9% | -11.7% | 1068 | 2.5 |
| 6 | Oxnard-Thousand Oaks-Ventura, CA | $2,996,700 | -4.1% | -5.0% | 645 | 2.3 |
| 7 | New York-Newark-Jersey City, NY-NJ | $2,964,565 | 2.1% | -1.1% | 11520 | 2.3 |
| 8 | Crestview-Fort Walton Beach-Destin, FL | $2,871,781 | -4.0% | -0.9% | 1376 | 2.2 |
| 9 | San Diego-Chula Vista-Carlsbad, CA | $2,818,099 | -1.1% | -5.0% | 2290 | 2.2 |
| 10 | San Francisco-Oakland-Fremont, CA | $2,629,175 | -2.4% | -6.9% | 2387 | 2.1 |
While luxury properties continue to sell more rapidly than they did a year prior across all categories, the 95th percentile saw an improvement of 4 days, while the 99th percentile improved by 3 days during the same timeframe. The overall median listing time remained unchanged from a year ago at 53 days. The luxury market is still experiencing a slightly faster transaction rate compared to last summer, despite a year-over-year (YoY) decline in prices.
Bridgeport-Stamford-Danbury, CT, maintained its leading position for the second month in a row, with its 90th-percentile threshold remaining stable month over month at $4.2 million, although it is down 4.4% compared to the previous year. Los Angeles secured the second position despite experiencing a 2.2% decline this month, while Kahului-Wailuku, Hawaii, completed the top three with its threshold showing a nearly unchanged YoY figure at -0.4%, marking the smallest annual change among the markets listed.
Naples-Marco Island, FL, was the sole market within the top 10 most expensive to record a year-over-year increase, rising by 4.1% to $3,733,572, which reflects a continued trend of strength in the Gulf Coast Florida market. Conversely, San Jose-Sunnyvale-Santa Clara, CA, experienced the most significant drop in the group, decreasing by 11.7% year over year and 6.9% month-over-month (MoM).
A significant change is observed in the San Francisco-Oakland-Fremont, CA metropolitan area, which has re-entered the top 10 this month. Meanwhile, Santa Rosa-Petaluma, CA, which recently occupied the No. 5 position in May, has dropped out of the ranking due to its trailing 12-month average of million-dollar listings decreasing to 494, falling below the 500-listing threshold required for inclusion on this list. The threshold for San Francisco stands at $2,629,175, reflecting a 6.9% decline year over year. Its return to the rankings coincides with the AI-related liquidity dynamics we discussed last month, where equity events at Bay Area technology firms have sustained some luxury demand, despite the ongoing broader market correction.
Top 10 Metros with the Highest Share of Vacation Homes:
| Rank | Area | Metro/Micro | Share of Vacation Homes |
Median Listing Price |
10% Most Expensive Listings Start at: |
Median Square Feet ($1 – $2 Million) |
| Metric | U.S. | County | 3.3 % | $430,000 | $1,277,907 | 3,000 |
| 1 | Nantucket, MA | Micro | 55 % | $4,925,000 | $14,117,250 | 1,011 |
| 2 | Vineyard Haven, MA | Micro | 54 % | $2,500,000 | $8,235,000 | 1,652 |
| 3 | Breckenridge, CO | Micro | 46 % | $948,500 | $3,725,000 | 1,754 |
| 4 | Morehead City, NC | Micro | 34 % | $577,450 | $1,567,000 | 2,786 |
| 5 | Barnstable Town, MA | Metro | 33 % | $909,450 | $3,355,500 | 2,402 |
| 6 | Kill Devil Hills, NC | Micro | 31 % | $649,000 | $1,399,949 | 3,028 |
| 7 | Atlantic City-Hammonton, NJ | Metro | 29 % | $554,500 | $2,574,050 | 1,956 |
| 8 | Heber, UT | Micro | 28 % | $1,447,500 | $6,038,000 | 2,744 |
| 9 | Boone, NC | Micro | 28 % | $669,738 | $1,994,400 | 3,041 |
| 10 | Edwards, CO | Micro | 28 % | $1,024,500 | $5,740,750 | 1,636 |
Note: Markets were ranked by that share, limited to areas with at least 100 million-dollar listings in June. Nationally, just 3.3% of the housing stock falls into this category, a baseline that makes the concentration in the country’s top vacation markets stand out even more.
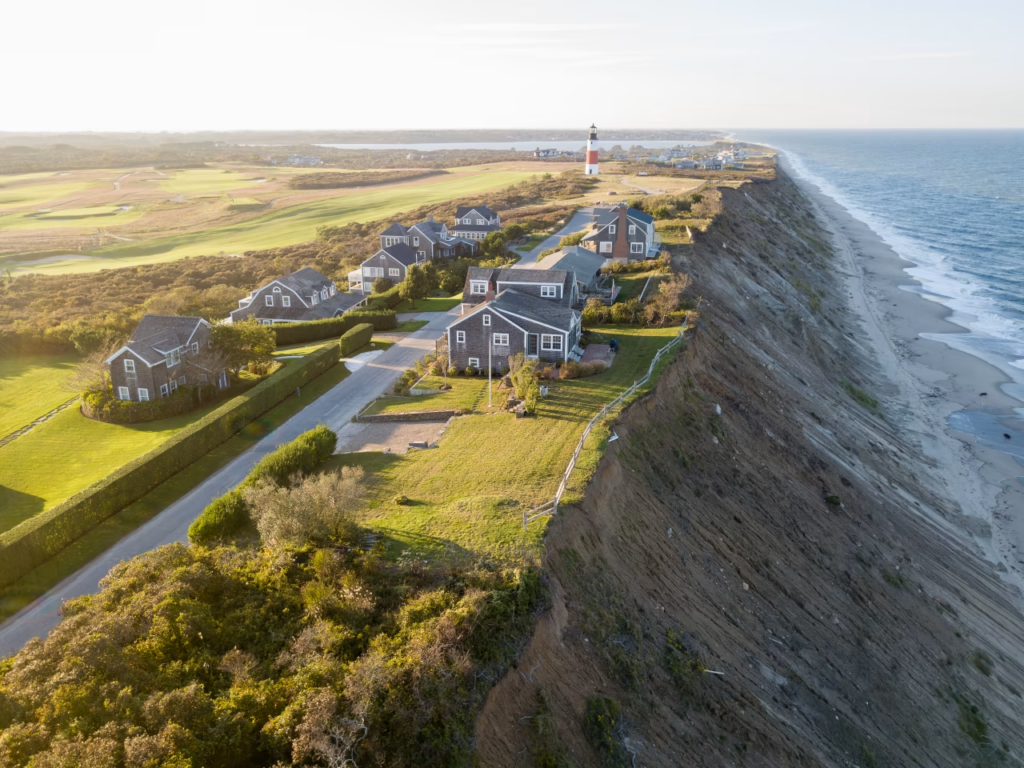
Nantucket, MA, led the rankings with a share of 55%, closely followed by Vineyard Haven, MA, at 54.4%. Both islands boast a vacation-home share approximately 17 times greater than the national average and are classified as Pure Luxury Markets, where the median home price exceeds the national luxury benchmark. Breckenridge completed the top three with a share of 45.8%, representing the highest proportion among the mountain destinations listed.
The relationship between vacation concentration and price size is not aligned. Nantucket presents the highest entry point among the top 10% of listings, priced at $14,117,250; however, the median home within the $1 million to $2 million range measures only 1,011 square feet, the smallest of all analyzed markets. Similarly, Hailey, Idaho, exhibits a comparable trend: a median listing price of $1,299,750 is accompanied by a top-10% threshold of $9,655,000, indicating a narrow yet extreme luxury segment layered over a significantly more modest overall market. In these areas, buyers are investing in scarcity and location rather than mere square footage.
Geographically, the list is divided between coastal destinations, such as Nantucket, Vineyard Haven; Barnstable Town, MA; and Naples-Marco Island, FL, and mountain retreats like Breckenridge, Heber, Utah, and Hailey, ID, with Petoskey, MI, representing lakeside markets. Notably, Naples-Marco Island is the sole metropolitan area to feature on both this list and among the 10 most expensive luxury markets nationwide, where its entry point to the top 10% increased by 4.1% YoY, marking the only annual increase within that group.
This overlap positions Naples as somewhat of an anomaly. The majority of the nation’s most expensive luxury markets, such as Bridgeport-Stamford-Danbury, CT, which maintained the top position for the second consecutive month at $4.2 million, down 4.4% from the previous year, are primarily influenced by urban and financial-center demand rather than vacation allure. San Jose-Sunnyvale-Santa Clara, CA, experienced the most significant annual decline in the group, decreasing by 11.7%.
Pace of the Luxury Market 2026 — U.S.:
| Indicator | June 2026 | Monthly (Days) | YoY (Days) |
| Median Days on Market 90th Percentile | 63 | 5 days slower | 2 days faster |
| Median Days on Market 95th Percentile | 69 | 3 days slower | 4 days faster |
| Median Days on Market 99th Percentile | 88 | 2 days slower | 3 days faster |
| Median Days on Market Median Listing | 53 | 1 day slower | Unchange |
“Most of the country’s priciest luxury markets are chasing something different than these vacation towns,” Smith said. “Bridgeport, CT, and Los Angeles are proxies for financial wealth. Meanwhile, Nantucket, MA, and Breckenridge, CO, are proxies for escape. They all just happen to land in the same price bracket.”
The San Francisco-Oakland-Fremont area in California presents a different perspective on the current market situation. This metro area has re-entered the list of the top 10 most expensive regions this month, following the decline of Santa Rosa-Petaluma, California, which fell below the 500-listing threshold necessary for inclusion in the ranking.
Market analysts have suggested that the equity gains experienced by tech workers in the Bay Area may be contributing to a resurgence in high-end demand, despite the fact that prices across the wider metro area have decreased by 6.9% compared to the previous year. This premium is distinct from that seen in Nantucket or Breckenridge; it is driven by wealth creation rather than a scarcity of location, yet it still falls within the same luxury category.
As the overall luxury market continues to experience a downturn, the distinction between demand driven by wealth and that driven by scarcity is likely to become increasingly pronounced, especially in markets where there is limited potential for supply expansion.
To read more, click here.