
Survey on the Access to Finance of Enterprises: lending conditions tightened
20 July 2026
- Firms reported further net tightening of bank loan interest rates and other loan conditions related to price and non-price factors.
- Firms signalled a small increase in financing needs, while availability of bank loans remained broadly unchanged, but with notable differences between SMEs and large firms.
- Firms expected lower increases in selling prices, non-labour input costs and wage expectations.
- Inflation expectations at the one, three and five-year horizons remained largely stable.
In the most recent round of the Survey on the Access to Finance of Enterprises (SAFE), covering the second quarter of 2026, euro area firms reported a strong net increase in interest rates on bank loans (net 42%, compared with 26% in the previous quarter). A similar increase was observed by both small and medium-sized enterprises (SMEs) and large firms. At the same time, a net 31% of firms (down from 37% in the previous quarter) reported increases in other financing costs (i.e. charges, fees and commissions) and in collateral requirements (net 10%, down from 14% in the first quarter of 2026) (Chart 1).
In this survey round, firms reported a small increase in financing needs for bank loans (a net 2% of firms, up from 0% in the first quarter of 2026), accompanied by broadly unchanged availability (net -1%, compared with -3% in the first quarter of 2026). Both SMEs and large firms signalled slightly higher financing needs, although loan availability showed a diverging pattern, rising for large firms (net 4%) but declining for SMEs (net -4%). As a result, the bank loan financing gap – an index which captures the difference between the need for and the availability of bank loans – remained positive and was slightly higher at 3%, up from 2% in the previous quarter (Chart 2). Looking ahead, fewer firms than before expect the availability of external financing to deteriorate.
Firms continued to perceive the general economic outlook to be the main factor constraining the availability of external financing (net 29%, compared with 26% in the previous survey round) but indicated further improvements in banks’ willingness to lend (net 6%, up from 5%). In this survey round, a net 10% of firms indicated that they expected their firm-specific outlook to have a more negative impact, in terms of sales and profits, on the availability of external financing (up from 8% in the previous survey round).
On average, firms expected selling prices, non-labour input costs and wage expectations to rise more moderately over the next 12 months (Chart 3). Firms expected selling prices to increase by 3.2% (down from 3.5%), while non-labour input costs, including energy, were projected to rise by 5.2% (down from 5.8%). Wage expectations eased further and were expected to increase by 2.5%, down from 2.8% in the previous quarter (Chart 3).
In this survey round, firms’ inflation expectations remained broadly unchanged while the dispersion of expectations over the short term decreased. Median one-year-ahead and three-year ahead inflation expectations stood at 3.0% (unchanged), while median five-year-ahead inflation expectations increased slightly to 3.1% (from 3.0% in the previous quarter) (Chart 4). The risk assessment for firms’ five-year-ahead inflation outlook was broadly unrevised, with the share reporting upside risks prevailing at 65%.
The ongoing war in the Middle East has created significant challenges for euro area firms (Chart 5). In response to ad hoc questions, firms highlighted seeking alternative suppliers (36% for input/materials, 29% for energy) and investing in energy efficiency (31%) as key strategies for responding to geopolitical tensions. Additionally, 21% reported increasing inventories or building stockpiles, while 15% mentioned revising insurance or trade finance arrangements. By contrast, only 8% reported reducing or suspending activity in affected export markets. Overall, large firms are more likely to have adopted coping strategies, while SMEs are less likely to have implemented or planned such measures.
Another set of ad hoc questions focused on the type of financing firms plan to use for investments in artificial intelligence (AI) technologies over the next 12 months (Chart 6). Firms anticipate funding these investments primarily through the use of internal funds (72%), with external sources such as bank loans, grants or leasing each accounting for around 16%. Equity/venture capital (6%) and debt securities (1%) are likely to be the least used financing options.
The report published today presents the main results of the 39th round of the SAFE for the euro area. The survey was conducted between 21 May and 26 June 2026. In this survey round, firms were asked about economic and financing developments over the period between April and June 2026. Additionally, firms reported their expectations for euro area inflation, selling prices and other costs. The sample comprised 5,087 firms in the euro area, of which 4,679 (92%) had fewer than 250 employees.
For media queries, please contact: Benoit Deeg, tel.: +49 172 1683704.
Notes
Chart 1
Changes in the terms and conditions of bank financing for euro area firms
(net percentages of respondents)
Base: Firms that had applied for bank loans (including subsidised bank loans), credit lines, or bank or credit card overdrafts. The figures refer to rounds 31 to 39 of the survey (April-June 2024 to April-June 2026). Notes: Net percentages are the difference between the percentage of firms that report an increase for a given factor and the percentage that report a decrease. The data included in the chart refer to Question 10 of the survey.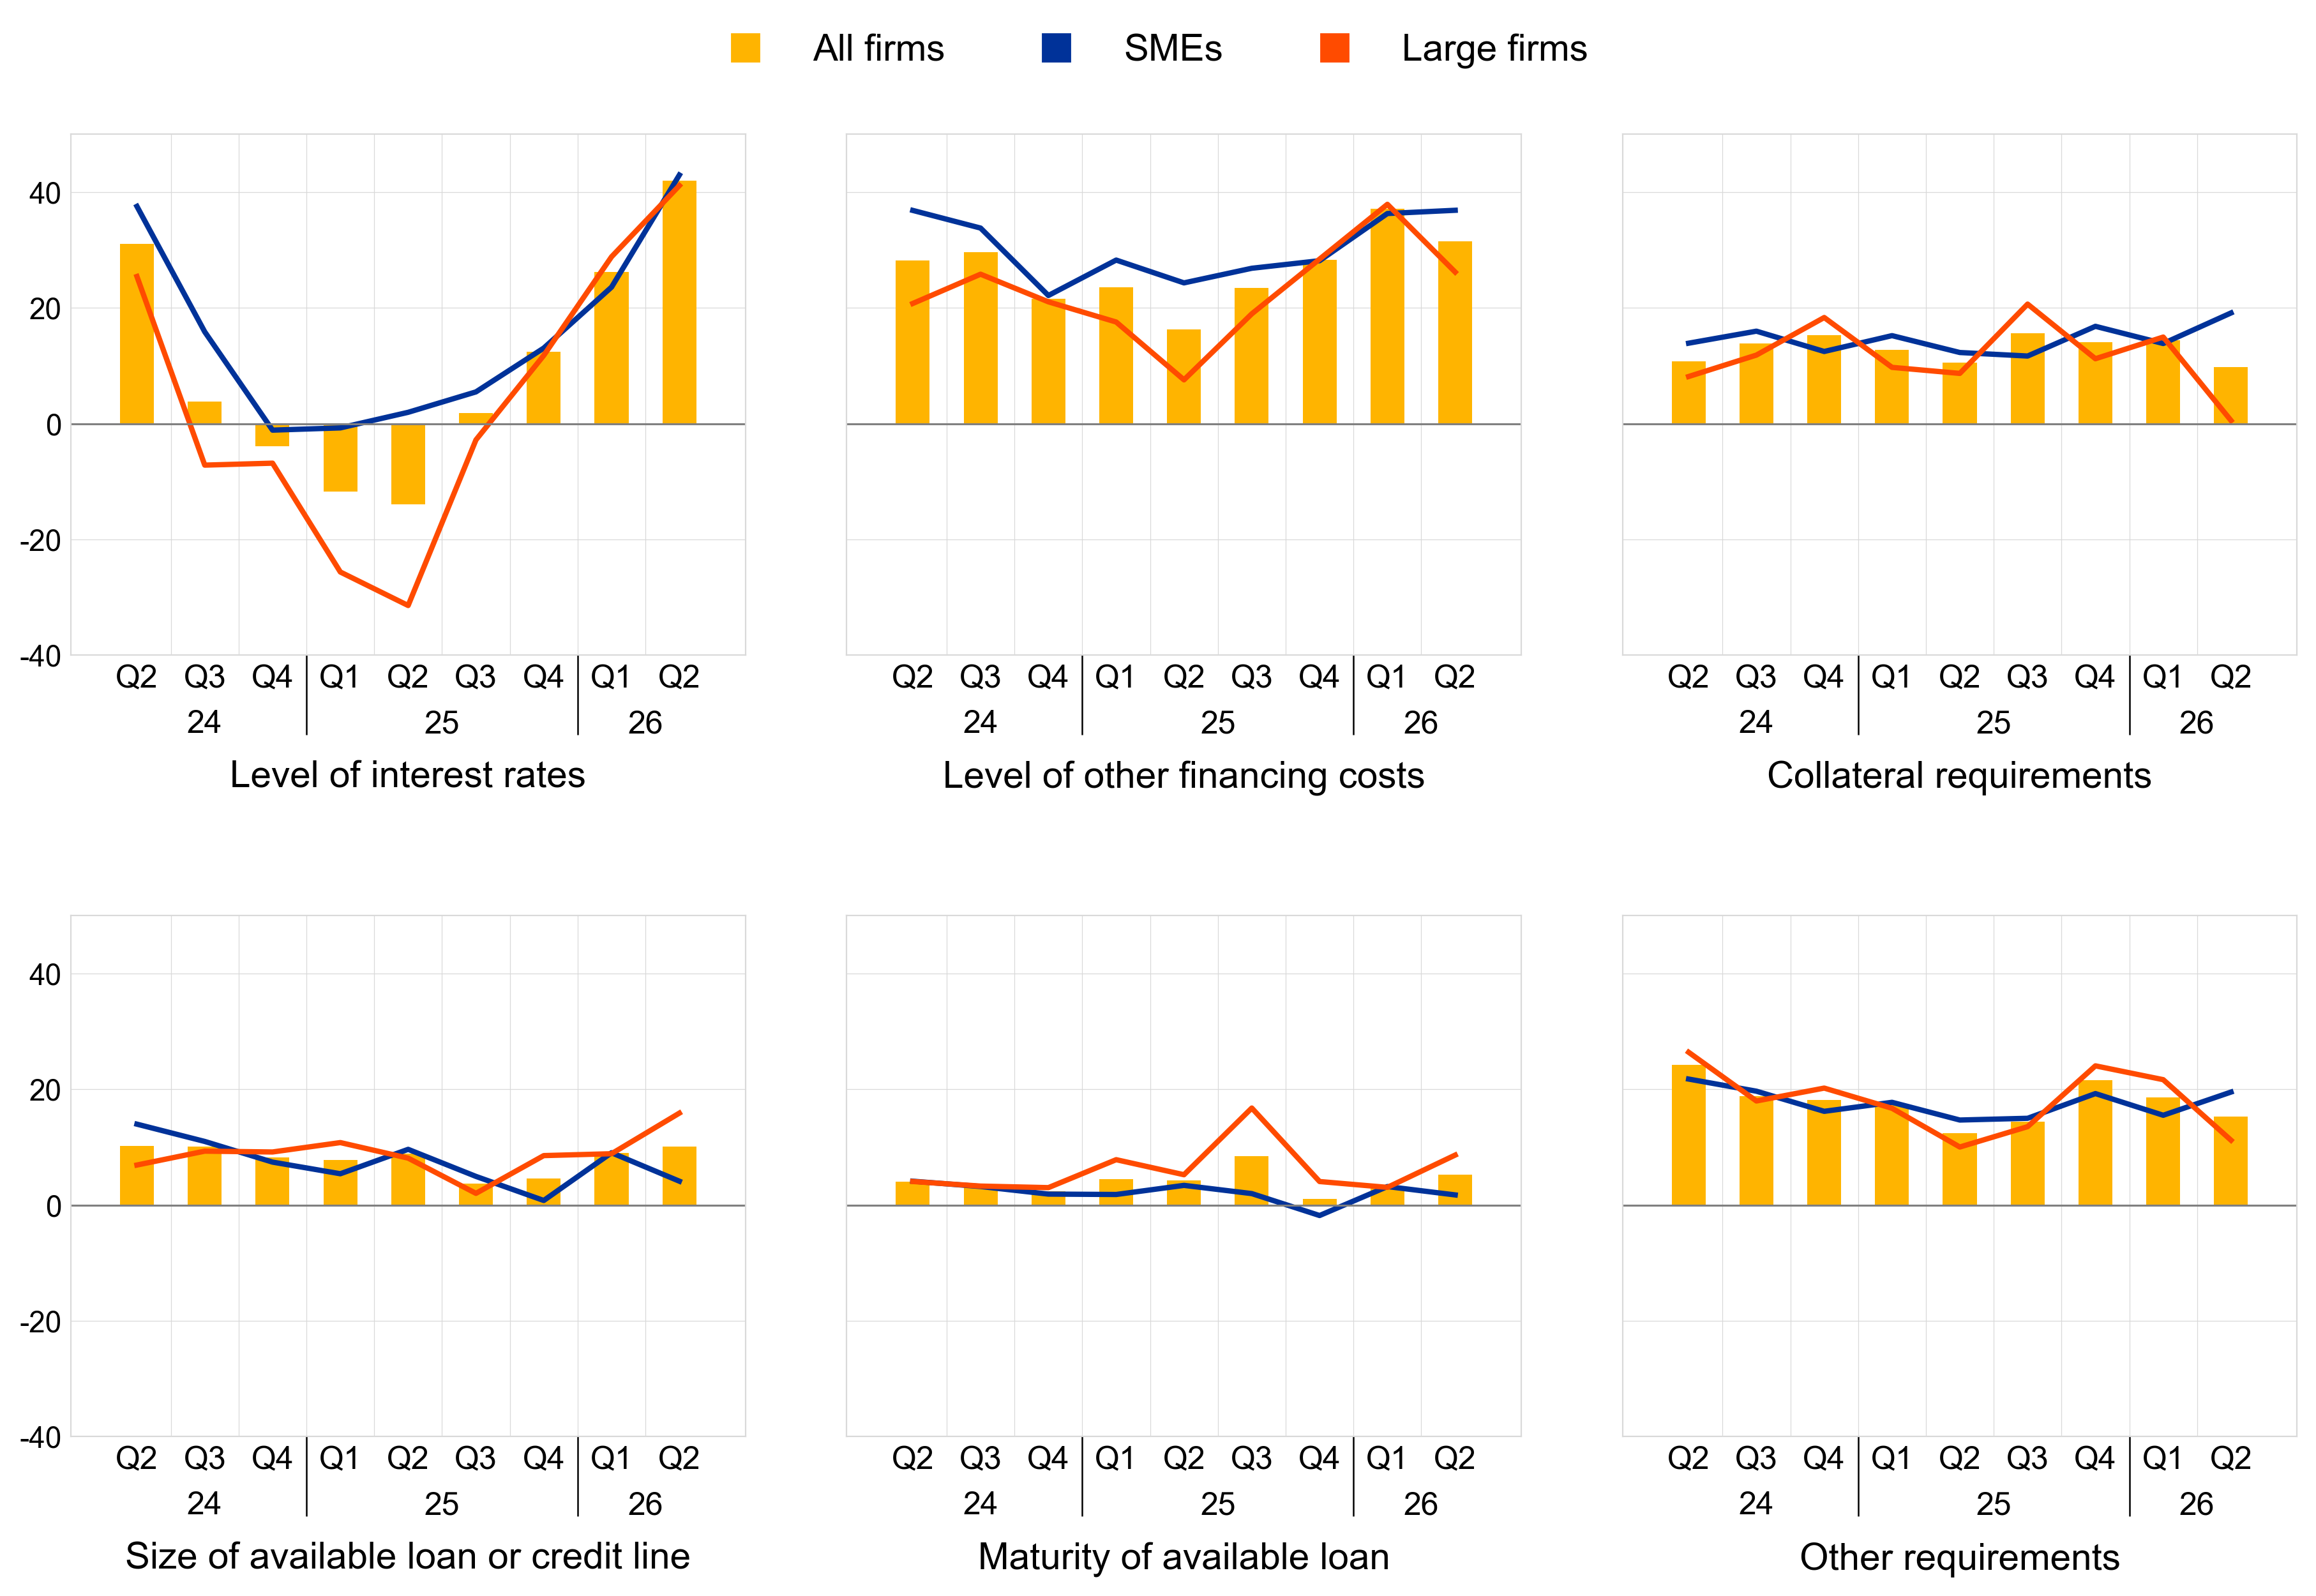
Chart 2
Changes in euro area firms’ financing needs and the availability of bank loans
(net percentages of respondents)
Base: Firms for which the instrument in question is relevant (i.e. they have used it or have considered using it). Respondents who replied “not applicable” or “don’t know” were excluded. The figures refer to rounds 31 to 39 of the survey (April-June 2024 to April-June 2026). Notes: The financing gap indicator combines both financing needs and the availability of bank loans at the firm level. The indicator of the perceived change in the financing gap takes a value of 1 (-1) if the need increases (decreases) and availability decreases (increases). If firms perceive only a one-sided increase (decrease) in the financing gap, the variable is assigned a value of 0.5 (-0.5). A positive value for the indicator points to a widening of the financing gap. Values are multiplied by 100 to obtain weighted net balances in percentages. The data included in the chart refer to Question 5 and Question 9 of the survey.
Chart 3
Expectations for selling prices, wages, input costs and employees one year ahead, by size class
(percentage changes over the next 12 months)
Base: All firms. The figures refer to pilot 2 and rounds 30 to 39 (March 2024 to June 2026) of the survey, with firms’ replies collected in the last month of the respective survey waves. Notes: Weighted average euro area firms’ expectations of changes in selling prices, wages of current employees, non-labour input costs and number of employees for the next 12 months using survey weights. The statistics are computed after trimming the data at the country-specific 1st and 99th percentiles. The data included in the chart refer to Question 34 of the survey.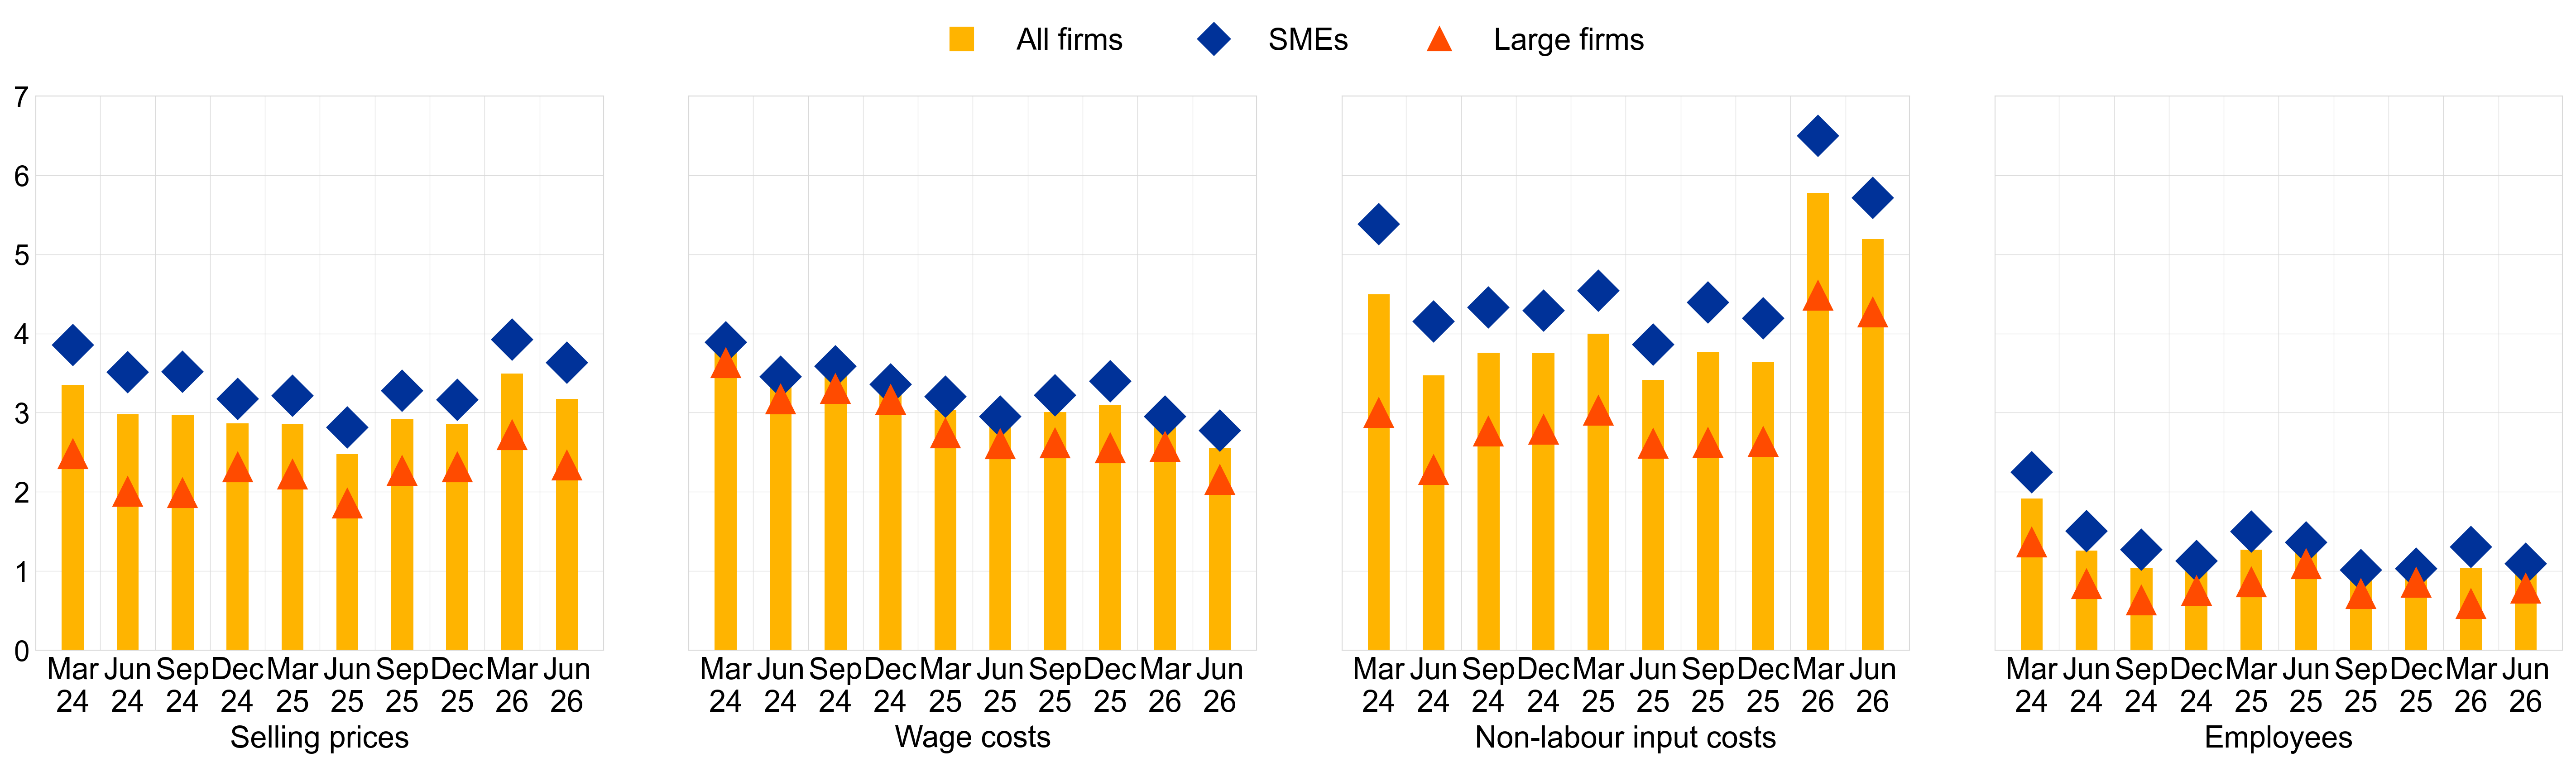
Chart 4
Firms’ median expectations for euro area inflation by size class
(annual percentages)
Base: All firms. The figures refer to rounds 30 to 39 (March 2024-June 2026) of the survey, with firms’ replies collected in the last month of the respective survey waves. Notes: Survey-weighted median, mode and interquartile ranges of firms’ expectations for euro area inflation in one year, three years and five years. Quantiles are computed by linear interpolation of the mid-distribution function. The statistics are computed after trimming the data at the country-specific 1st and 99th percentiles. The data included in the chart refer to Question 31 of the survey.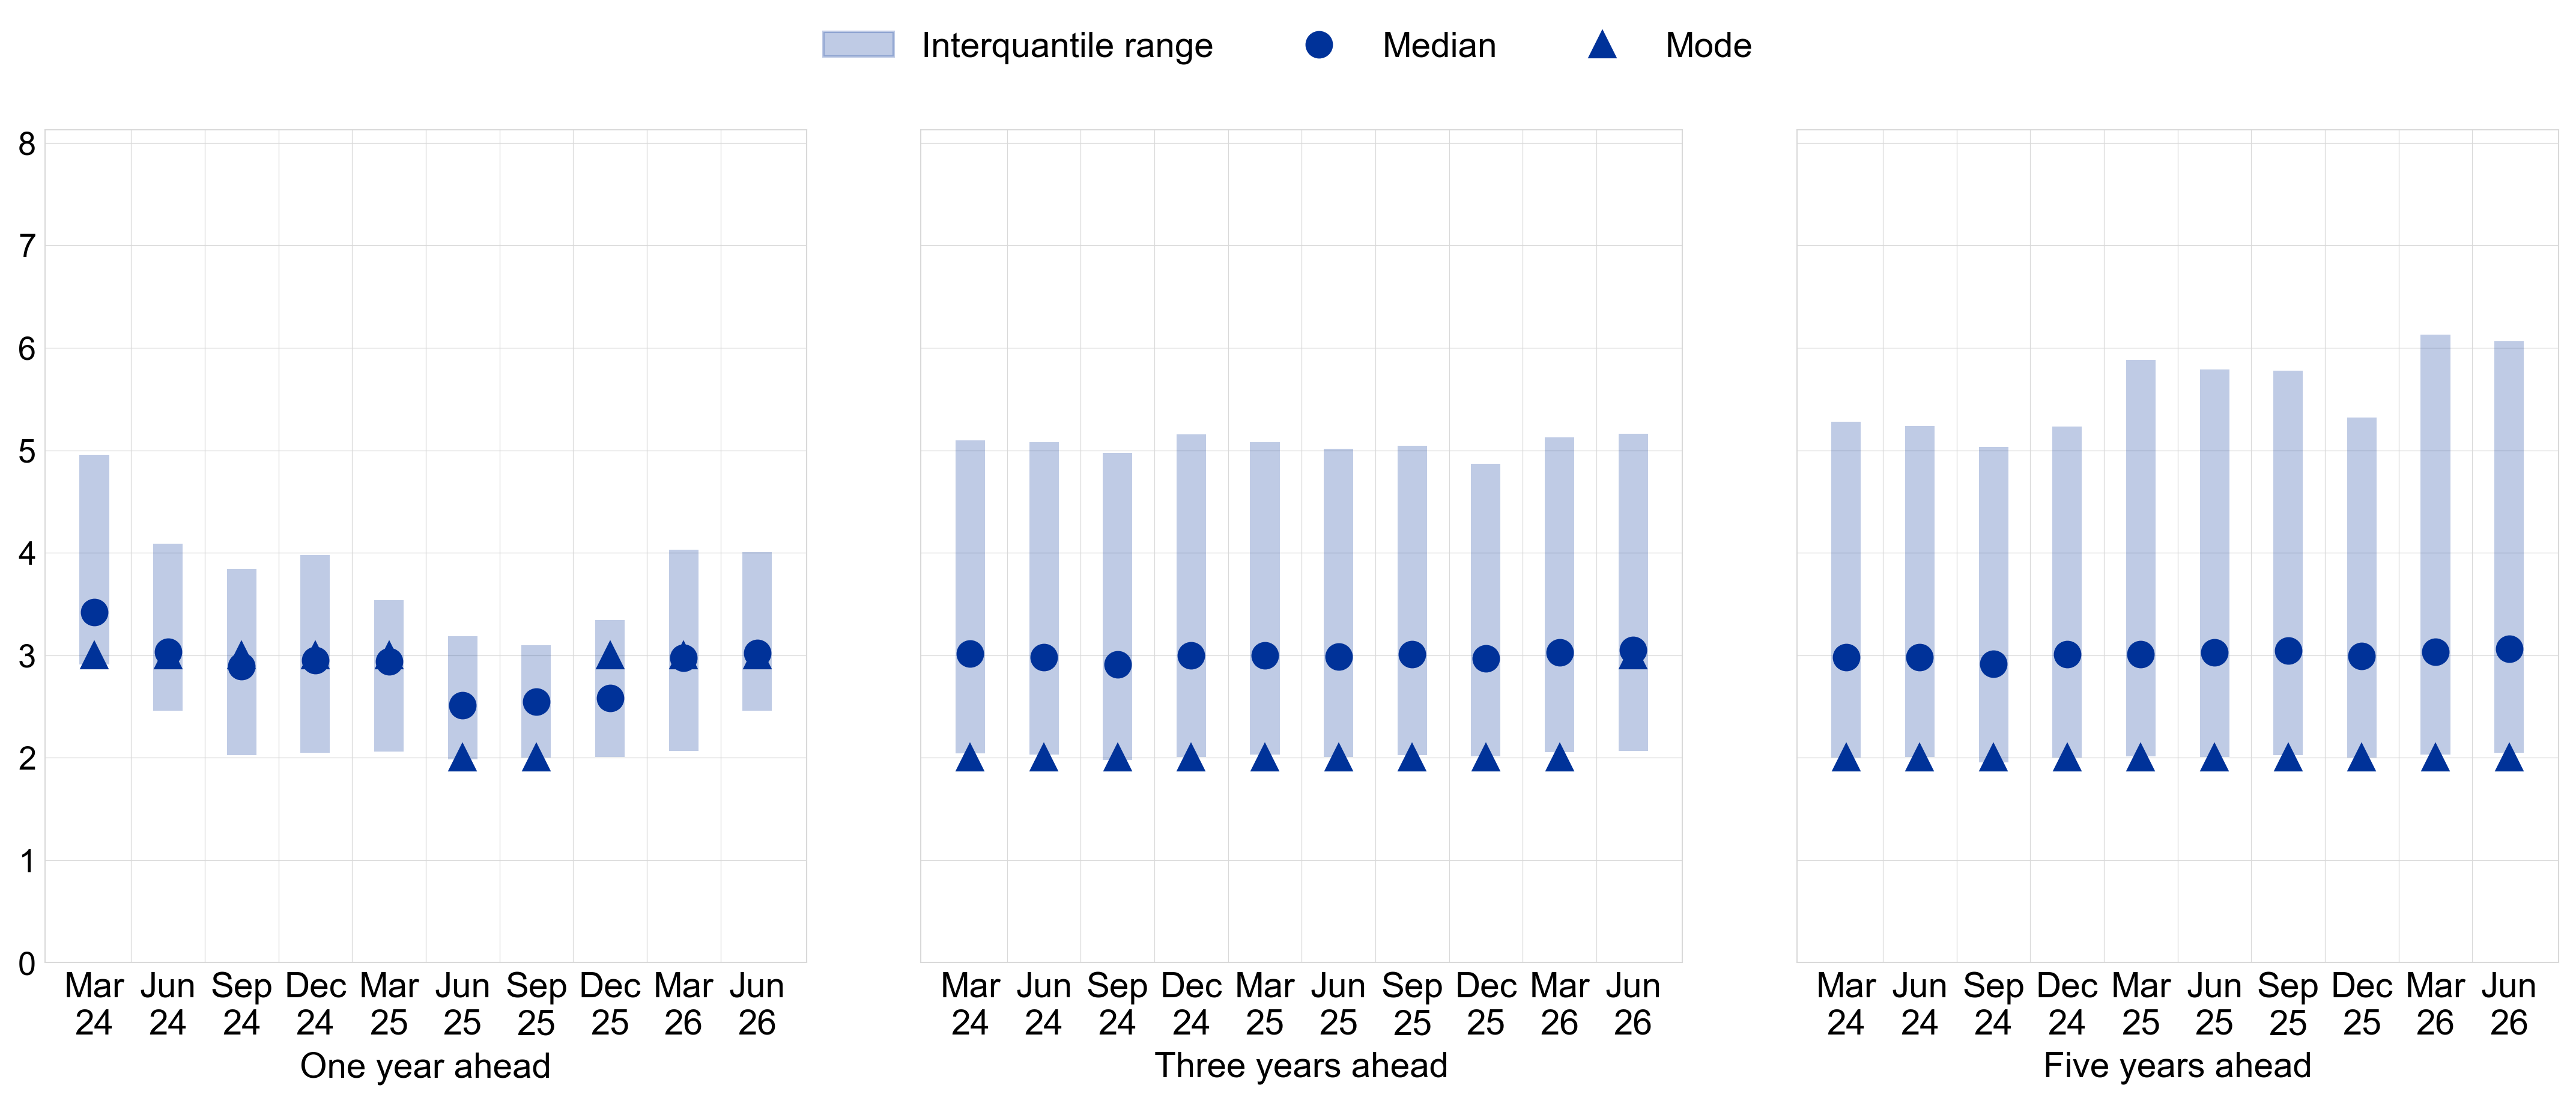
Chart 5
Firms’ strategies in response to geopolitical tensions following the conflict in the Middle East, by size class
(percentages of respondents)
Base: All firms. The figures refer to round 39 of the survey (April-June 2026). Notes: The chart shows the weighted share of firms by their planned strategies over the next 12 months in response to the war in the Middle East, for all firms and by size class. The data included in the chart refer to Question QA3_2026Q2 of the survey.
Chart 6
Types of financing sources for AI investment
(percentages of respondents)
Base: All firms that expect to invest in AI technologies over the next 12 months in Question QB1_2026_Q2. The figures refer to round 39 of the survey (April-June 2026). Notes: The chart shows the weighted share of firms by type of financing sources for planned AI investment over the next 12 months. The data included in the chart refer to Question QB2_2026Q2 of the survey.