Riverwater Partners Q2 2026 Small Cap Macro Letter

Ole_CNX/iStock via Getty Images
Laying the Tracks: Capital, Infrastructure, and the Small Cap Opportunity Inside the AI Buildout
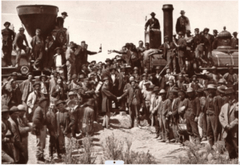
The investors largely did not do fine. The farmers who could ship wheat to the coast, the settlers who moved west in 7 days instead of months, and the merchants who built the interior economy on its tracks did. This distinction, between the builders of transformative infrastructure and the users of it, is the oldest pattern in the history of capital allocation, and the most useful frame for understanding where small cap investors should be looking right now.
How Big Is the AI Data Center Buildout in 2026?
The numbers are worth stopping on. The five largest hyperscalers — Amazon (AMZN), Alphabet (GOOGL), Microsoft (MSFT), Meta (META), and Oracle (ORCL) — are projected to spend over $600 billion on infrastructure in 2026, a 36% increase from 2025, with roughly 75% of that figure, about $450 billion, tied directly to AI infrastructure.³ In fact, each of Amazon, Microsoft, Alphabet, and Meta individually exceeds $100 billion in annual infrastructure spending on its own.⁴ Capital intensity has surged to 45 to 57% of revenue at the largest players, a ratio that historically describes utilities and industrial manufacturers, not technology companies.
Zooming out, McKinsey estimates that data centers worldwide will require nearly $7 trillion in capital expenditures by 2030 to keep pace with compute demand, with roughly $5.2 trillion of that tied specifically to AI workloads.⁵ This is the figure that matters for understanding the supply chain downstream, since more than 40% of that global spending is expected to occur in the United States.
How AI Capex Is Driving US GDP Growth
At some point in the first half of 2025, data center investment — a single line item in the national accounts — began carrying the US economy. Harvard economist Jason Furman estimated that investment in information processing equipment and software accounted for 92% of GDP growth in H1 2025, despite representing just 4% of total GDP. Excluding this category, annualized growth would have been approximately 0.1%.⁶ It is unlikely that the AI buildout’s contribution to GDP has lessened since the first half of 2025. Renaissance Macro Research estimated that the dollar value contributed to GDP growth by the AI data-center buildout had surpassed US consumer spending.
We want to be clear about what this means. It does not mean the US economy is healthy across the board. The AI capex wave is providing a headline GDP number that obscures meaningful weakness in consumer spending, residential construction, and broad business investment outside the technology sector. For small cap investors with a quality focus, this distinction matters.
AI Capex vs. Railroads, Apollo, and the Interstate System
KKR (KKR) estimates AI-related capital expenditures already account for roughly 5% of US GDP, growing at a high-single to low-double-digit pace, a trajectory the firm describes as on par with the late-1990s technology boom.⁷ Historical research on the British railway manias of the 1840s and 1860s estimates those episodes involved capital investment equal to 15 to 20% of GDP, the equivalent of $3 to $4 trillion in today’s US economy.⁸ US electrification-era capital spending peaked at a smaller but still substantial share of GDP in the late 1920s, while the telecom and fiber buildout of 1996 to 2001 ran at roughly 1.0% of GDP.
Canals (1820s–1840s): ~1–2% of GDP at peak. Investors mostly broke; shippers enormously enriched.
Railroads ((1840s–1880s)): ~15–20% of GDP in peak years for the largest manias. Investors mostly broke; shippers, farmers, and manufacturers enormously enriched.⁹
Electrification ((1920s–1930s)): a substantial share of GDP at peak. Utilities earned modest regulated returns; every factory and household that ran on cheap electricity won.¹⁰
Telecom / Fiber ((1996–2001)): ~1.0% of GDP. Telecoms accumulated over $1 trillion in obligations. The internet economy that ran on their fiber for the next two decades was built on cheap, overbuilt infrastructure.¹¹
Builders of transformative infrastructure rarely capture the long-run value they create. The productivity payoff almost always accrues to the users who arrive after the construction is done and find cheap, abundant capacity waiting for them. History gives us reason to look downstream.
The Funding Mix Is Shifting
One nuance worth noting: the telecom buildout of the late 1990s was financed almost entirely with debt, which is what made the bust so catastrophic. Today’s AI infrastructure spending has been funded primarily by the extraordinary free cash flows of highly profitable businesses. This is not your father’s fiber bubble. But the funding mix is shifting. Hyperscalers issued roughly $121 billion in new corporate debt in 2025 alone, more than four times their 2020 to 2024 annual average, and Morgan Stanley (MS) and J.P. Morgan (JPM) estimate the technology sector may need to issue as much as $1.5 trillion in new debt over the next few years to finance the buildout.¹² Capital intensity has reached levels where aggregate capex, after buybacks and dividends, now exceeds projected free cash flow for some players. The rhyme is not perfect. But it is audible.
5 Small Cap Sectors Benefiting from the AI Buildout
The S&P 500’s AI trade is a technology trade dominated by five companies. Small Cap’s AI trade is, in large part, an industrials and power infrastructure trade.
Consider what actually has to happen to build a hyperscale data center. Land must be acquired and permitted. Foundations must be poured. Structural steel must be erected. Electrical switchgear and transformers must be sourced (many on backorder now). High-voltage power must be delivered. Cooling systems must be designed and installed, and on and on.
The International Energy Agency projects that global electricity demand from data centers will more than double by 2030, reaching roughly as much electricity as the whole of Japan consumes today, with AI-optimized data centers driving the bulk of that growth.¹³ The Electric Power Research Institute projects US data centers could consume 9 to 17% of total US electricity by 2030, up from roughly 4 to 5% today, more than doubling their current share.¹⁴ The electrical grid is facing its first sustained demand growth in two decades, driven almost entirely by this buildout. Natural gas, the bridge fuel for AI’s power appetite, is seeing demand surge in ways that connect directly to our existing research on the energy sector. Much of the construction work is being done by companies that will never appear in a headline about artificial intelligence.
Five Channels of Small-Cap Exposure
We think about Small Cap’s exposure to this buildout across five channels:
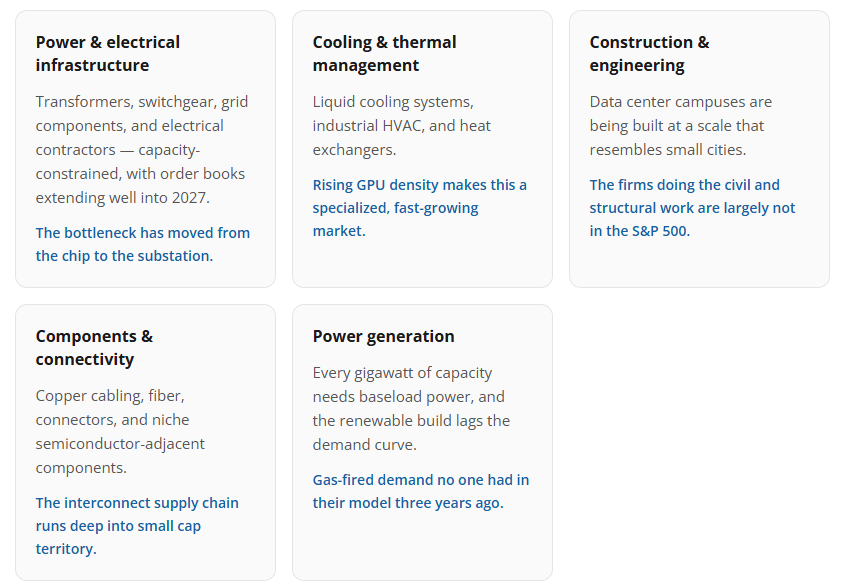
Superior Business, Superior Management, and Attractive Valuation are the criteria we apply regardless of sector or theme. The AI buildout does not change our process. What it does is sharpen our conviction that certain industries we have long followed — electrical infrastructure, specialty industrial, energy services — are experiencing a demand inflection the market has been slower to appreciate at the small cap level than at the large cap level.
AI Bubble Risks: Circular Financing and Capex Air-Pockets
The historical analogies cut in both directions. If the AI buildout rhymes with the railroad or telecom buildouts, then the companies doing the physical work of construction at the peak of the cycle may be late-cycle cyclicals dressed as secular growth stories. Capex air-pockets are real. When hyperscalers moderate their spending, even temporarily, the order books at their suppliers compress faster than the headlines suggest.
There is also a more specific echo of Union Pacific worth naming. Crédit Mobilier worked because the railroad’s own promoters owned the construction company building it, billed the project well above cost, and reported the inflated activity as legitimate growth.¹⁵ By 2026, analysts had identified hundreds of billions of dollars in what is now called circular financing across the AI supply chain: chipmakers and cloud providers investing in the AI labs that are also their largest customers, who spend that capital buying infrastructure from the same investors.¹⁶ Nvidia (NVDA)’s proposed $100 billion investment in OpenAI (OPENAI), tied to OpenAI’s purchase of Nvidia systems, is the clearest example, but the pattern recurs across Microsoft, Oracle, AMD (AMD), and CoreWeave.¹⁷ The legal comparison to Crédit Mobilier does not hold, but the economic shape rhymes: revenue that looks organic can be the same dollars circling among a handful of interconnected firms.
Demand Validation and the Cost of Capital
There is also the question of demand validation more broadly. The hyperscalers are spending hundreds of billions annually on the assumption that AI monetization will grow into this infrastructure. Cloud and AI-specific product revenue are both growing, but the ratio of capex to AI-specific incremental revenue remains wide. A cheaper architecture that reduces compute intensity per unit of AI output could flatten the demand curve for infrastructure faster than current order books imply. Chinese models today cost a fraction of where western models are.
We are also watching the funding shift. The Bank for International Settlements notes that hyperscaler gross bond issuance topped $100 billion in 2025, with most of it long-term debt locking in funding for multi-year buildouts, while credit default swap spreads have risen, especially for hyperscalers with lower credit ratings, reflecting uncertainty around the projects’ eventual payoffs.¹⁸ The cost of capital for this buildout is rising. That changes the math on marginal projects at the edge of the supply chain. None of this is a reason to avoid the theme. It is a reason to apply quality criteria carefully, to distinguish between companies with durable competitive positions and pricing power within the buildout’s supply chain, and those simply riding a demand wave they will not be able to sustain when the water recedes.
Why We Believe Small Caps Are Positioned to Benefit from AI Infrastructure
For most of 2023 and 2024, the Russell 2000 lagged the megacap indices significantly, spending nearly four years range-bound while the Nasdaq added 145%. The valuation gap between large and small caps reached historically wide levels. Year-to-date in 2026, the Russell 2000 has outpaced the S&P 500 by roughly 6 percentage points.¹⁹ Earnings growth for small caps is projected to outpace the S&P 500 by nearly double digits this year.²⁰

Source: Furey Research Partners
The AI buildout is, slowly, unevenly, imperfectly, broadening the set of industries and companies that benefit from the largest infrastructure investment since the electrification of the American economy a century ago. The companies doing the electrical work, laying the copper, running the cooling systems, and generating the power are not front page news stories. Several of them are in our portfolio. We have been building positions in companies that meet our quality criteria and are exposed to demand we believe is durable, not because the AI story is exciting, but because someone needs to lay the tracks, and the companies best positioned to profit from it are still reasonably priced. As we’ve argued before, the biggest beneficiaries in small caps should ultimately be the users of AI. Small cap operating margins have trailed large cap margins for years ((see chart)) — a gap driven largely by scale. AI changes that math, handing smaller companies operating leverage they previously couldn’t reach without tremendous investment. Just like the farmers and settlers of the Wild West.
As always, thank you for your trust and confidence. Please reach out with any questions.
Adam Peck, CFA | Co-Founder & Chief Investment Officer | Riverwater Partners LLC
Citations
¹ Wikipedia, “History of the Union Pacific Railroad”; cost converted to 2025 dollars.
² Wikipedia, “Crédit Mobilier Scandal”: Union Pacific executives billed the project approximately $94 million for construction costing roughly $50 to $60 million, pocketing the difference. The railroad fell into bankruptcy in 1893 amid broader overexpansion across the industry.
³ Introl, “Hyperscaler CapEx Hits $600B in 2026” ((Jan. 2026)); Investing. com, “Big Tech Will Spend $600B on AI in 2026” ((Feb. 2026)), citing CreditSights estimates.
⁴ ValueAddVC, “Big Tech AI Spending 2026” (2026); CNBC, “Tech AI Spending Approaches $700 Billion in 2026” ((Feb. 2026)).
⁵ McKinsey & Company, “The Cost of Compute: A $7 Trillion Race to Scale Data Centers” (2025); McKinsey, “The Data Center Dividend” ((Oct. 2025)).
⁶ Jason Furman via Data Center Dynamics ((Oct. 2025)); CRE Daily, “Data Centers Power Most of US GDP Growth in 2025” ((Dec. 2025)). Renaissance Macro Research; “Without Data Centers, GDP Growth Was 0.1% in the First Half of 2025.” Fortune, 7 Oct. 2025, Without data centers, GDP growth was 0.1% in the first half of 2025, Harvard economist says | Fortune.
⁷ KKR, “Beyond the Bubble: Why AI Infrastructure Will Compound Long after the Hype” ((Nov. 2025)).
⁸ Andrew Odlyzko, “The Railway Manias of the 1840s and 1860s”; cited in Andrew Coyle, “The AI Hype Cycle: Boom, Bust, or Breakthrough? ” synthesizing peak British railway investment at 15-20% of GDP.
⁹ Andrew Odlyzko, “The Railway Manias of the 1840s and 1860s”; cited in Andrew Coyle, “The AI Hype Cycle: Boom, Bust, or Breakthrough? ” synthesizing peak British railway investment at 15-20% of GDP.
¹⁰ Industry capex and historical economic data on US electrification-era spending and the 1996-2001 telecom and fiber buildout.
¹¹ Industry capex and historical economic data on US electrification-era spending and the 1996-2001 telecom and fiber buildout.
¹² Mellon Investments, “Record-Breaking AI-Related Debt Issuance in 2025” ((Dec. 2025)), citing Morgan Stanley and J.P. Morgan projections.
¹³ International Energy Agency, “Energy and AI” special report (2025).
¹⁴ Electric Power Research Institute, “Powering Intelligence 2026” ((Feb. 2026)).
¹⁵ Wikipedia, “Crédit Mobilier Scandal”: Union Pacific executives billed the project approximately $94 million for construction costing roughly $50 to $60 million, pocketing the difference. The railroad fell into bankruptcy in 1893 amid broader overexpansion across the industry.
¹⁶ BlockEden. xyz, “The Great AI Circular Financing Loop” ((March 2026)); Bloomberg, “AI Circular Deals” ((March 2026)).
¹⁷BlockEden. xyz, “The Great AI Circular Financing Loop” ((March 2026)); Bloomberg, “AI Circular Deals” ((March 2026)).
¹⁸ Bank for International Settlements, “Financing the AI Infrastructure Boom: On- and Off-Balance Sheet Borrowing” ((March 2026)).
¹⁹ FinancialContent / MarketMinute, “Small-Cap Rotation” ((March 2026)); CME Group (CME) OpenMarkets (2026).
²⁰ Columbia Threadneedle Investments, “Why Own US Small Caps in 2026? ” Why own US small caps in 2026.
Editor’s Note: The summary bullets for this article were chosen by Seeking Alpha editors.