Nasdaq 100 tops 20-year returns at 21%; Nifty Midcap leads Indian markets: Which investment created more wealth?
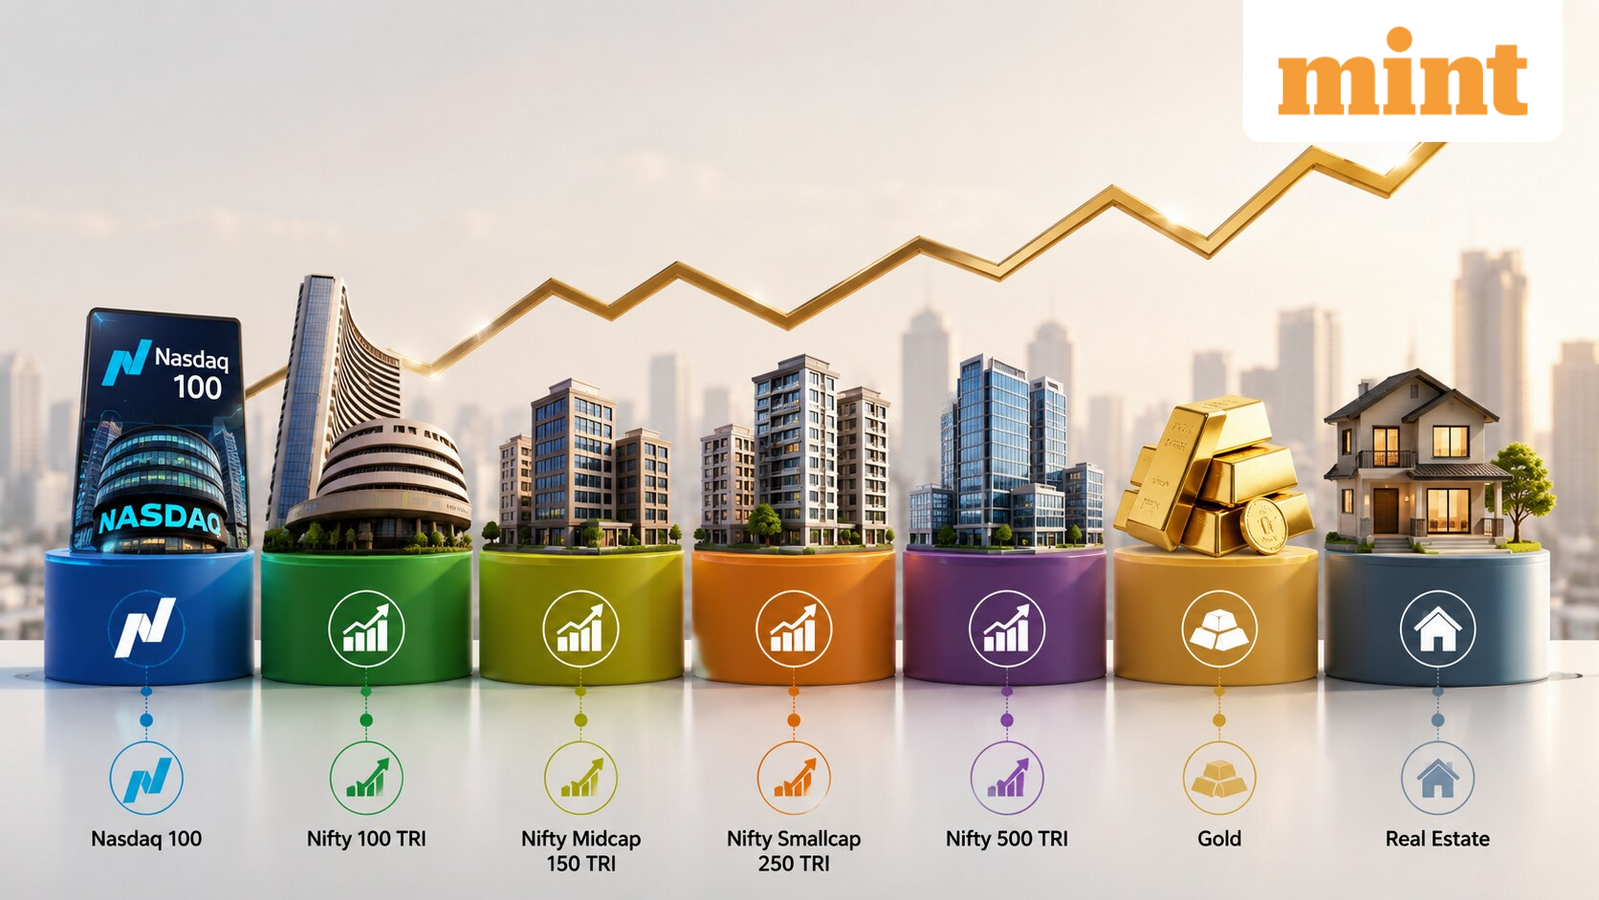
A comparison of returns across major asset classes, including the Nasdaq, Nifty indices, gold, and real estate, reveals an interesting trend.
While gold delivered the strongest returns over the medium term, the Nasdaq 100 emerged as the biggest long-term wealth creator over 10, 15, and 20 years. Among Indian equity indices, mid-caps delivered the highest returns over the 20-year period.
The data compares annualised returns (CAGR) across the Nasdaq 100, Nifty 100 TRI, Nifty Midcap 150 TRI, Nifty Smallcap 250 TRI, Nifty 500 TRI, gold, and real estate over different investment horizons.
| Basis | 1-Yr Return | 3-Yr Returns | 5-Yr Returns | 10-Yr Returns | 15-Yr Returns | 20-Yr Returns |
| Nasdaq 100 | 48.4% | 33.0% | 22.5% | 26.5% | 26.0% | 21.3% |
| Nifty 100 TRI (Large Cap) | -3.6% | 10.5% | 10.5% | 12.8% | 11.9% | 12.5% |
| Nifty Midcap 150 TRI | 4.2% | 20.0% | 18.3% | 18.2% | 17.2% | 16.3% |
| Nifty Smallcap 250 TRI | 0.1% | 19.6% | 16.8% | 15.4% | 14.7% | 14.2% |
| Nifty 500 TRI (Flexi Cap) | -1.7% | 12.9% | 12.4% | 13.9% | 12.7% | 12.9% |
| Gold (in ₹) | 35.3% | 34.4% | 23.8% | 15.6% | 12.3% | 13.9% |
| Real Estate | 4.3% | 5.6% | 5.9% | 5.2% | 5.6% | 7.9% |
*Source: FundsIndia Research; CAGR as on 30 June, 2026; Nasdaq 100 returns are adjusted for the USD-INR rate
Which one created the highest wealth over the years?
Over the 1-year period, the Nasdaq 100 delivered the highest return of 48.4%. For the 3-year and 5-year periods, gold emerged as the best-performing asset.
The picture changes over longer horizons. In the last 10 years, the Nasdaq 100 generated an annualised return of 26.5%, while over 15 years, it delivered 26% returns.
The gap becomes even more pronounced over 20 years. The Nasdaq 100 delivered the highest annualised return of 21.3%, surpassing every Indian equity index, gold and real estate. This means that ₹10,000 invested two decades ago in Nasdaq would have grown to nearly ₹4.75 lakh today.
How have Indian equity markets performed over the years?
Among Indian equity indices, the Nifty Midcap 150 TRI delivered the highest long-term return, generating 16.3% annually in the last 20 years. At this rate, ₹10,000 invested 20 years ago would have grown to around ₹2.05 lakh.
The Nifty Smallcap 250 TRI followed with an annualised return of 14.2% over a 20-year period, although it delivered only 0.1% return in the last year.
The Nifty 500 TRI, which represents the broader market and is often used as a benchmark for flexi-cap funds, gave 12.9% returns over 20 years. Its one-year return was negative at 1.7%.
The Nifty 100 TRI, which tracks large-cap stocks, generated the lowest annualised return among the equity indices at 12.5% in the last 20 years. It also declined by 3.6% in the last year.
Disclaimer: This is purely for educational/ informational purposes and should not be taken as any sort of investment advice. Always consult a SEBI-registered advisor before making any investment decisions.