Alternatives ETFs Punching Above Their Weight in 2026

Halfway through the year, the U.S. equity market performance is broadening. That said, market concentration remains incredibly high, while equity and bond correlations sit in positive territory — conditions that scream a call for diversification. Investors are heeding that call, many with alternatives ETFs.
Key Takeaways:
- Alternative ETFs are seeing strong demand
- Structural diversification is fueling inflows as market concentration and positive equity-to-bond correlations challenge investors
- Strategies Like IALT and Trend-Followers stand out, but strategy types are diverse.
When we look at the equity market, three things are immediately clear. First, broadening is indeed afoot.
A look at equal-weighted S&P 500 portfolios, as well as small- and midcap strategies ,show that capital appreciation is happening well beyond the largest U.S. stocks such as the Magnificent Seven. The Invesco S&P 500 Equal Weight ETF (RSP) is outpacing the SPDR S&P 500 (SPY) this year.
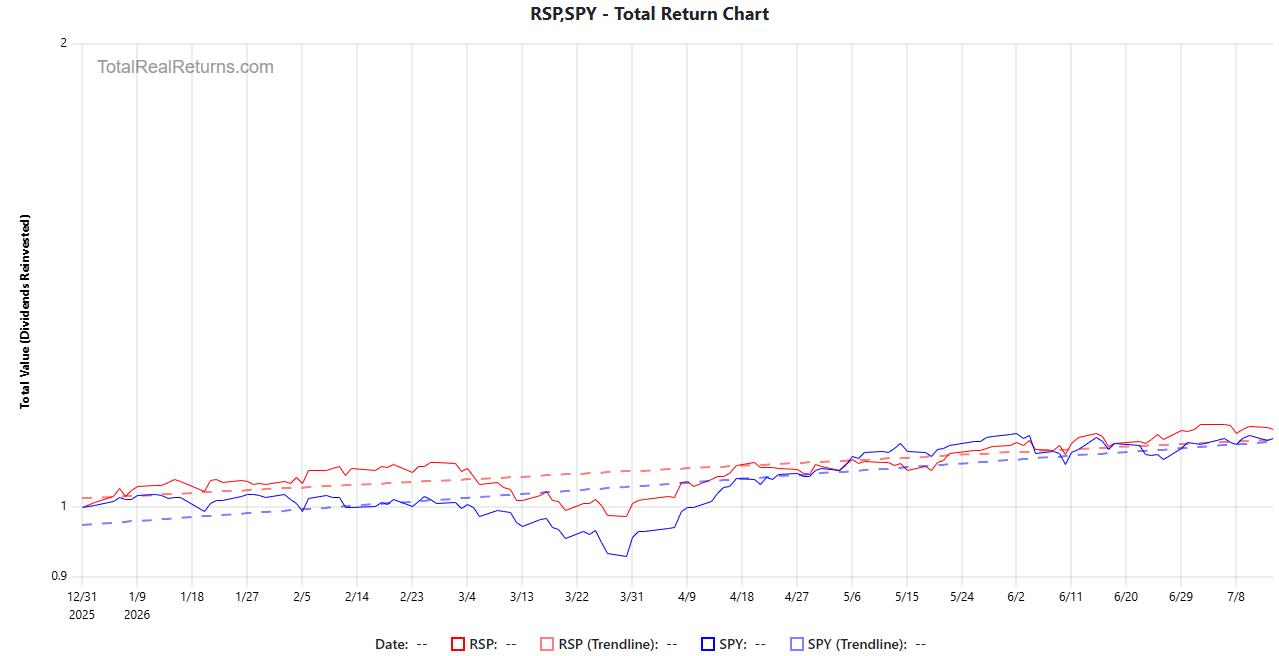
Source: Total Real Returns
We also see that the top 10 holdings in the S&P 500 command about 38% of the benchmark. Concentration risk remains very real.
And finally, equity-to-bond correlation is positive, partly driven by sticky inflation and a higher-for-longer rate environment. That relationship between the two means diversification is jeopardized in a traditional stocks-plus-bonds portfolios.
Alternatives ETFs Deliver Unique Return Streams
At a glance, alternatives ETFs have taken in nearly $30 billion in net new assets so far in 2026 — almost $2 billion just this month — across a myriad of strategy types. This amounts to about 2.5% of all ETF flows across all categories this year.
While that may seem small in the face of the $1.12 trillion of net new money that has already landed in ETFs in 2026, consider that total assets in alternatives ETFs represent around 0.8% of the overall U.S. ETF market today. That pace of net creations this year suggests that alt ETFs, from an asset gathering perspective, are punching well above their usual weight.
Leading inflows is the iShares Systematic Alternatives Active ETF (IALT), an actively managed multi-strategy liquid alt ETF that targets both market-neutral gains (making money regardless of index direction) and tactical market exposure. The fund does that by using systematic, data-driven computer algorithms to combine differentiated sources of return across equities, credit, and macro strategies.
The portfolio of 1,800-plus holdings is up 12.2% year-to-date, outpacing the S&P 500 returns while yielding about 2.4%, which compares to a SEC yield of 3.5% for the iShares 0-3 Month Treasury Bond ETF (SGOV).
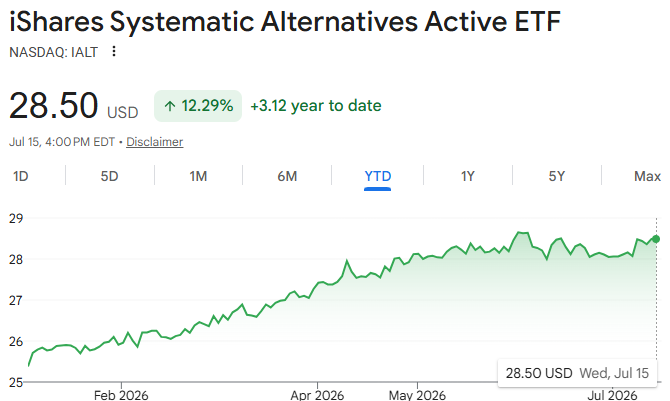
Source: Google
IALT is leading the asset flows charts with nearly $5 billion in net new assets this year. The fund was a beneficiary of BlackRock’s rotation strategy in May, landing in model portfolios as BlackRock moved capital away from long-dated U.S. bonds and reallocated to liquid alternatives in an effort to diversify and mitigate systemic risks.
Managed Futures ETFs Delivering Diversification
In a similar vein, managed futures ETFs, such as the iMGP DBi Managed Futures Strategy ETF (DBMF) and the Simplify Managed Futures Strategy ETF (CTA), have also seen large net creations this year, benefiting from this push for diversification.
DBMF has taken in $1.6 billion so far in 2026. CTA is nearing $450 million in inflows. They aren’t the only managed futures ETFs in the market, but are good examples of the demand for these strategies this year.
These trend-following ETFs trade liquid futures contracts across global markets, looking to simply detect and follow trends, rather than predict why an asset is moving and where it may be going.
DBMF vs. CTA
While the funds are in a similar category, they execute their trend-following mandates differently:
| Feature | iMGP DBi Managed Futures Strategy ETF (DBMF) | Simplify Managed Futures Strategy ETF (CTA) |
| AUM (approx.) | $3.3 Billion | $1.5 Billion |
| Expense Ratio | 0.85% | 0.75% |
| Methodology | Hedge Fund Replication. DBMF doesn’t generate its own trading signals. Instead, its algorithm reverse-engineers the positions of the top 20 largest CTA hedge funds, replicating their average core exposures with a 2–4 week lag at a fraction of the cost. | Pure Quantitative Model. CTA runs a proprietary algorithm built by Altis Partners. It looks directly at market data to trade mathematical trends natively. |
| Asset Class Mix | Ultra-Broad: Cross-asset exposure spanning equities, fixed income, currencies, and commodities. | Non-Equity Focus: Intentionally avoids equity futures. It focuses purely on commodities and fixed income (rates), aiming to provide a cleaner defensive diversifier against stock market shocks. |
Source: VettaFi
A look at some of the biggest asset gatherers in the alternatives category show that investors have implemented many strategy types this year, including tax-aware, managed floors, and multi-asset portfolios, to name a few.
As concerns about market concentration and asset class correlations persist, alternatives ETFs remain well positioned to deliver their unique value in the pursuit of alternative return paths and broad portfolio diversification.
Top 10 Most Popular Alternatives ETFs in 2026 (as of July 14)
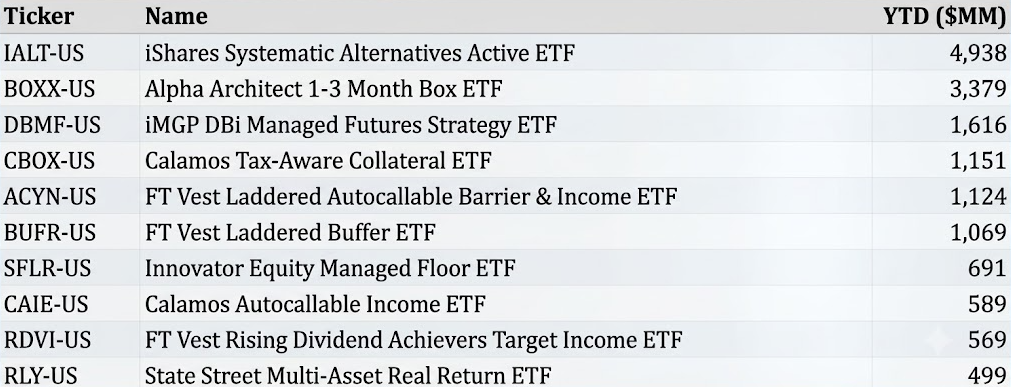
Source: VettaFi
For more news, information, and analysis, visit the Equity ETF Content Hub.
