Vacation-Home Mortgages Tick Up For First Time Since Pandemic Boom
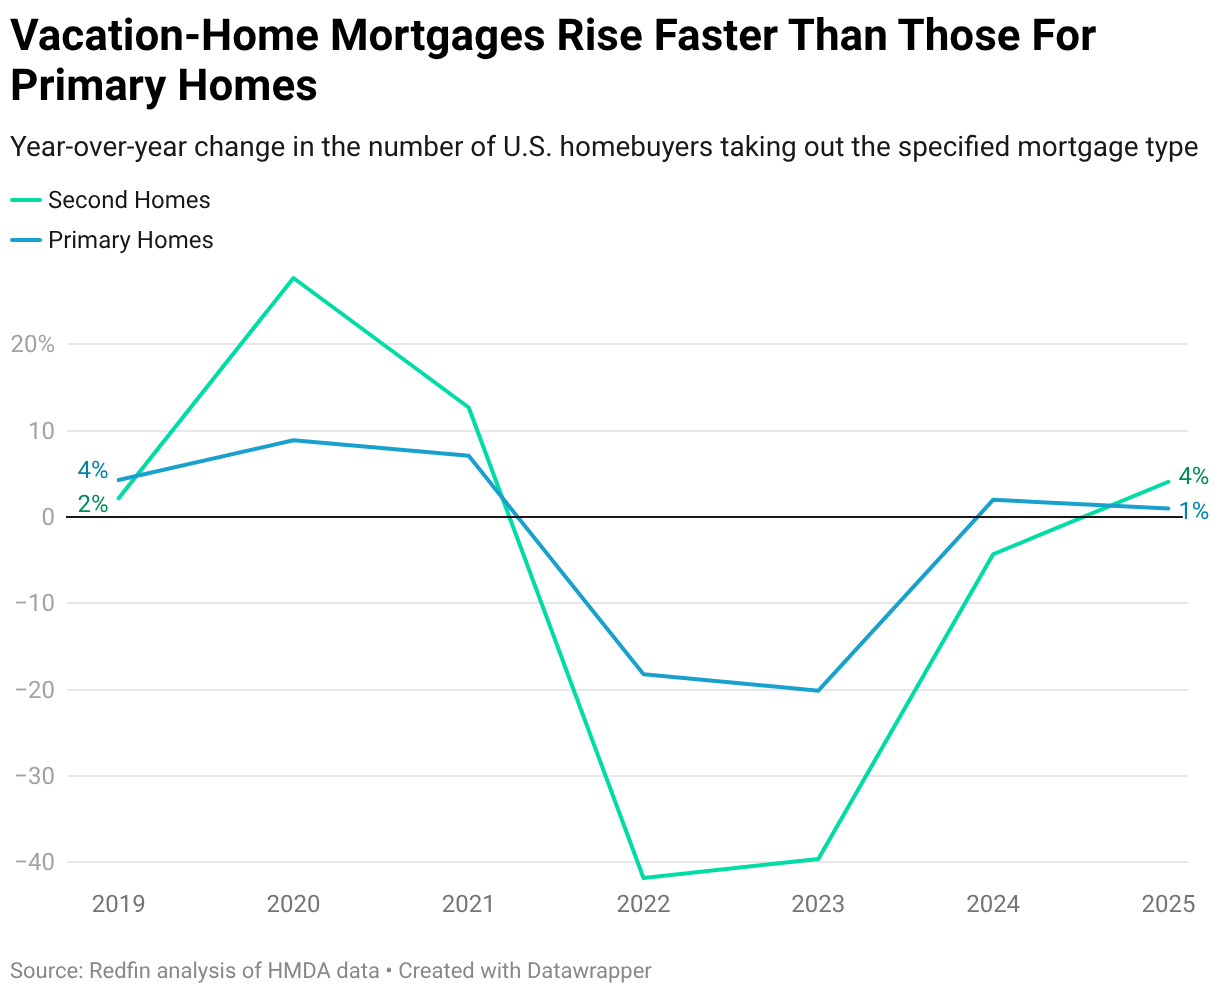
- Mortgages for second homes rose 4% year over year in 2025, the first annual increase in four years. That’s compared with a 1% increase for primary homes. Still, second-home mortgages account for just 3% of all home loans.
- Second-home purchases are rising because affluent buyers are fairly active in today’s housing market; additionally, demand dropped so low in 2024 that even a small pickup resulted in an annual increase.
- 85% of last year’s second-home mortgages went to high earners, 82% went to white people, and nearly 60% went to 45-64 year olds.
- Second homes were most common in West Palm Beach, the Jersey Shore and Palm Springs.
U.S. homebuyers took out 4.1% more second-home mortgages in 2025 than they did a year earlier. That marks the first annual increase in four years, following declines from the pandemic-era peak in 2021 until 2024.
By comparison, mortgages for primary homes ticked up 1% year over year in 2025 after rising 2% in 2024.
This is according to a Redfin analysis of Home Mortgage Disclosure Act (HMDA) data covering purchases of second homes, primary homes and investment properties in the U.S. from 2018 to 2025. The term “vacation home” is used interchangeably with “second home” in this report.
Second-home purchases are starting to rebound—and outpacing growth in purchases of primary homes—because affluent buyers, who are less constrained by today’s high housing costs and economic uncertainty, are driving the market. Vacation-home buyers are wealthier than people purchasing primary homes: 85% of 2025’s vacation-home mortgages went to high earners, who had a median income of just under $300,000. That’s compared with a median overall U.S. household income of $88,000.
Recent Redfin research shows that demand for luxury homes is growing much faster than demand for non-luxury homes, and second homes are more likely to fit into the luxury category. The typical second home was worth $515,000 in 2025, versus $395,000 for primary homes.
The uptick in second-home purchases is also partly the result of a base effect: Purchases dropped to half of pre-pandemic levels in 2024, so there was a lot of room to grow. That means that even a small pickup in demand for vacation homes–supported mostly by wealthy Americans–was enough to produce the first annual increase in four years.
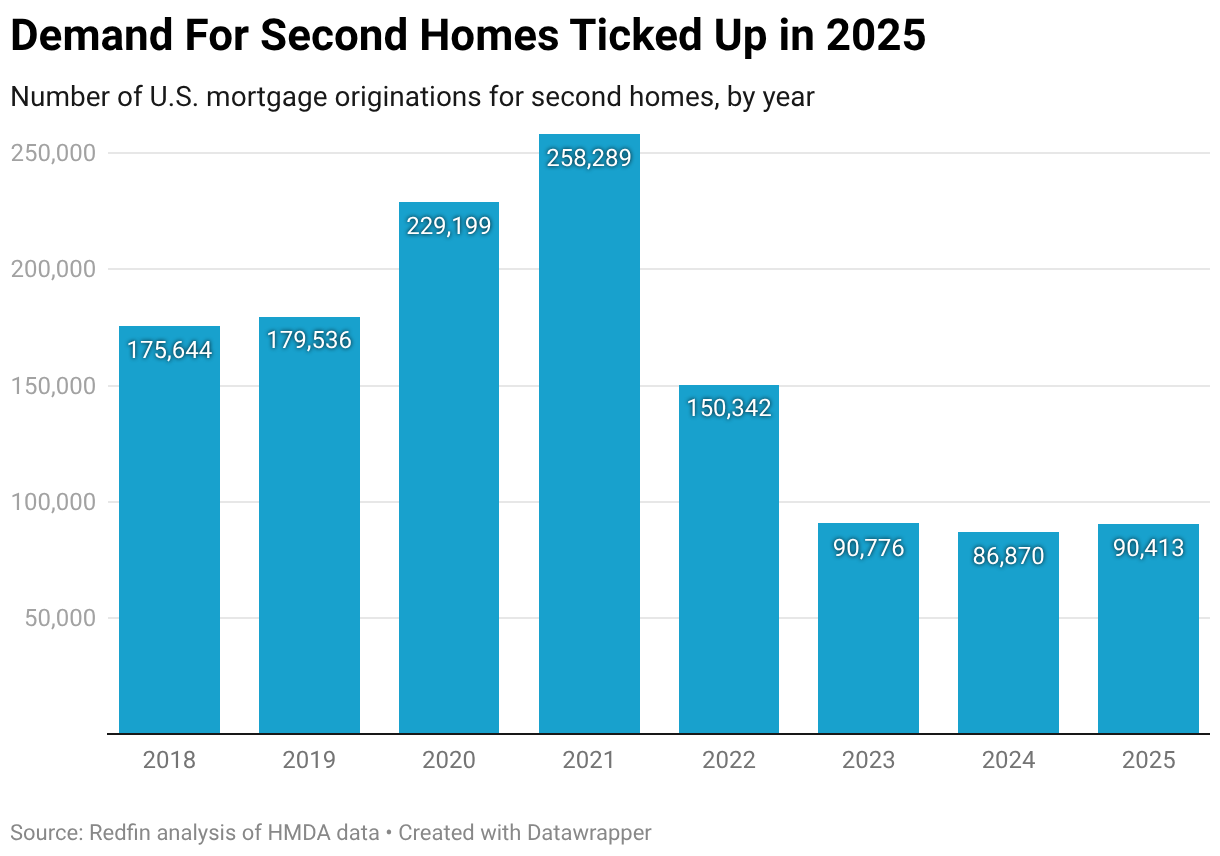
While second-home purchases have ticked up, they’re far less common than they were before and during the pandemic. That’s largely because record-high prices and elevated mortgage rates have cooled the housing market as a whole; many Americans are priced out of buying one home, let alone two.
Zooming in on the second-home market, demand is still fairly low largely because vacation homes aren’t a necessity the way primary homes are; a lot of would-be buyers backed off when housing costs skyrocketed in 2022. Additionally, the pandemic-era forces that fueled the vacation-home boom have faded; as more workers return to the office, fewer people have the flexibility to make use of a second home. And for buyers hoping to generate rental income, the economics have become less favorable as both the long-term and short-term rental markets have cooled.
“Vacation homes are making a modest comeback, but it’s a very different market than it was during the pandemic,” said Chen Zhao, Redfin’s head of economics research. “Today’s second-home buyers tend to have the financial flexibility to make a big, discretionary purchase even in an expensive housing market, while many would-be buyers of primary homes are sidelined by high costs. Vacation homes are less appealing for regular Americans than they were during the pandemic because mortgage rates are much higher now and rentals are less lucrative.”
The Americans Buying Vacation Homes: Wealthy, White, Gen X
We broke the data down by income level, race and age to find out which Americans bought second homes in 2025. Here’s what we found:
High earners: As noted above, the vast majority of mortgages for vacation homes, 85.2%, went to high earners. They had a median income of $294,000 in 2025. Just under 3% went to low-income buyers, who had a median income of $69,000.
White people: More than four in five (81.5%) vacation-home mortgages went to white homebuyers. Hispanic and Asian homebuyers trail far behind, with 5.6% and 5.2% of vacation-home mortgages, respectively. Black buyers took out 2.2% of them.
Gen Xers: Nearly one-third (31.1%) of vacation-home mortgages went to 55-64 year olds, and another 27.6% went to 45-54 year olds (Gen Xers were 45-60 in 2025). Next come 35-44 year olds (18.6%), 65-74 year olds (14.1%) and people under 35 (5.4%).
Second-Home Mortgages Account For Roughly 3% of All Home Loans
The share of total mortgages that went to second-home buyers was essentially flat from 2024 to 2025: 2.7% of all mortgage originations last year were for second homes, up marginally from 2.6% in 2024. That’s down from a peak of 5.1% in 2021.
The vast majority of mortgages go to buyers of primary homes. They took out nearly nine in 10 (87.7%) mortgages in 2025, compared with 88.1% in 2024 and 86.9% in 2021. The remainder go to people purchasing investment properties, with roughly one in 10 (9.6%) of all mortgages taken out in 2025 used for investment properties, compared with 9.3% in 2024.
Second Homes Are Most Common in West Palm Beach
Second-home mortgages made up the largest share of all loan originations in West Palm Beach, FL, a popular destination for snowbirds and vacationers; the metro is also a major driver of the nation’s luxury market. Just under 6% of all mortgage originations in the West Palm Beach metro in 2025 were for second homes.
Next comes the New Brunswick, NJ metro (the Jersey Shore), where 4.6% of 2025’s mortgages were for second homes. Riverside, CA (Palm Springs) comes in third, with second-home mortgages making up 3.8% of the total. Second-home mortgages rose year over year in all three of those places, especially New Brunswick, where they increased 13%.
On the flip side, second-home mortgages were least common in Oakland, CA and Montgomery County, PA, where they made up 0.5% of all mortgages. Next come Detroit, Cleveland and Philadelphia (0.6% apiece).
Second-Home Mortgages Increased in Most U.S. Metros
Mortgage originations for second homes increased in 35 of the 50 most populous U.S. metros last year. They rose most in Montgomery County, PA, posting a 28.8% year-over-year increase, and Indianapolis, with a 26.6% increase. But buying vacation homes is still uncommon in those places, with second-home mortgages making up less than 1% of all home loans.
Second-home loans fell most in Las Vegas, with a 20.9% year-over-year decline in 2025, though vacation-home mortgages still made up 2.7% of all home loans, the sixth-biggest share in the U.S. The next-biggest declines were in Los Angeles (-19.8%) and Philadelphia (-17.6%), places where vacation-home purchases are not all that prevalent, making up 1% of less of all loans.
| Metro-level summary: Mortgages for second homes, 2025
50 most populous U.S. metros. HMDA data. |
||||
| U.S. metro area | Second-home mortgage originations | Second-home mortgage originations, YoY change | Share of total mortgage originations that were for second homes | Median value of second homes |
| Anaheim, CA | 364 | -8.5% | 2.3% | $1,675,000 |
| Atlanta, GA | 645 | -3.2% | 0.9% | $455,000 |
| Austin, TX | 387 | 3.5% | 1.2% | $545,000 |
| Baltimore, MD | 289 | 21.4% | 1.0% | $595,000 |
| Boston, MA | 531 | 22.6% | 1.4% | $885,000 |
| Charlotte, NC | 531 | 2.9% | 1.3% | $495,000 |
| Chicago, IL | 543 | 13.6% | 0.8% | $415,000 |
| Cincinnati, OH | 216 | 19.3% | 0.8% | $355,000 |
| Cleveland, OH | 138 | 5.3% | 0.6% | $315,000 |
| Columbus, OH | 213 | 9.2% | 0.8% | $425,000 |
| Dallas, TX | 457 | -3.4% | 0.7% | $475,000 |
| Denver, CO | 555 | 16.1% | 1.4% | $665,000 |
| Detroit, MI | 95 | 1.1% | 0.6% | $275,000 |
| Fort Lauderdale, FL | 495 | 1.2% | 3.0% | $605,000 |
| Fort Worth, TX | 198 | 9.4% | 0.7% | $445,000 |
| Houston, TX | 933 | -11.1% | 1.1% | $405,000 |
| Indianapolis, IN | 276 | 26.6% | 0.9% | $375,000 |
| Jacksonville, FL | 612 | 4.8% | 2.5% | $485,000 |
| Kansas City, MO | 222 | 6.2% | 0.8% | $395,000 |
| Las Vegas, NV | 749 | -20.9% | 2.7% | $515,000 |
| Los Angeles, CA | 412 | -19.8% | 1.0% | $1,350,000 |
| Miami, FL | 366 | -10.5% | 2.1% | $885,000 |
| Milwaukee, WI | 144 | 0.0% | 0.9% | $425,000 |
| Minneapolis, MN | 503 | 10.5% | 1.1% | $465,000 |
| Montgomery County, PA | 103 | 28.8% | 0.5% | $620,000 |
| Nashville, TN | 425 | -2.5% | 1.5% | $550,000 |
| Nassau County, NY | 704 | 10.3% | 3.2% | $1,915,000 |
| New Brunswick, NJ | 1060 | 13.0% | 4.6% | $1,045,000 |
| New York, NY | 888 | 8.4% | 1.7% | $975,000 |
| Newark, NJ | 255 | 5.4% | 1.4% | $415,000 |
| Oakland, CA | 96 | -1.0% | 0.5% | $995,000 |
| Orlando, FL | 911 | -14.5% | 2.7% | $445,000 |
| Philadelphia, PA | 103 | -17.6% | 0.6% | $355,000 |
| Phoenix, AZ | 2033 | 9.8% | 3.2% | $545,000 |
| Pittsburgh, PA | 183 | 5.2% | 0.8% | $290,000 |
| Portland, OR | 260 | 4.8% | 1.0% | $575,000 |
| Providence, RI | 377 | 12.9% | 2.5% | $895,000 |
| Riverside, CA | 1464 | 2.7% | 3.8% | $675,000 |
| Sacramento, CA | 470 | 7.1% | 2.0% | $800,000 |
| San Antonio, TX | 430 | 5.1% | 1.3% | $345,000 |
| San Diego, CA | 440 | 21.5% | 2.1% | $1,270,000 |
| San Francisco, CA | 143 | 9.2% | 1.7% | $1,315,000 |
| San Jose, CA | 84 | 5.0% | 0.8% | $1,505,000 |
| Seattle, WA | 312 | 17.7% | 1.1% | $835,000 |
| St. Louis, MO | 293 | -1.3% | 0.9% | $325,000 |
| Tampa, FL | 1107 | -13.8% | 2.6% | $425,000 |
| Virginia Beach, VA | 397 | -7.5% | 1.6% | $555,000 |
| Warren, MI | 278 | 2.6% | 1.0% | $385,000 |
| Washington, DC | 449 | 6.4% | 0.9% | $645,000 |
| West Palm Beach, FL | 836 | 1.2% | 5.5% | $695,000 |
Methodology
The data in this report is from a Redfin analysis of Home Mortgage Disclosure Act (HMDA) data covering purchases of second homes, primary homes and investment properties from 2018-2025. The term “vacation home” is used interchangeably with “second home” in this report. For this report, the median “worth” or “value” of second homes is the median property value from HMDA data itself, which is reported by the mortgage loan originator as either the home’s appraised value or sale price.