The Major Metros Where a Typical Luxury Home Costs Less Than $1 Million
- The number of major metros where you can buy a luxury home for less than $1 million is down five from eight last year.
- Detroit is the most affordable metro for luxury homes, with a median price of $719,252—47.7% less than the typical luxury home nationwide, $1,374,470.
- San Francisco is the most expensive, with a median sale price of over $6.6 million.
- Luxury homes in Indianapolis, St. Louis and Columbus crossed the $1 million threshold.
The typical luxury home costs less than $1 million in five of the top 49 most populous metros, down from eight in 2025.
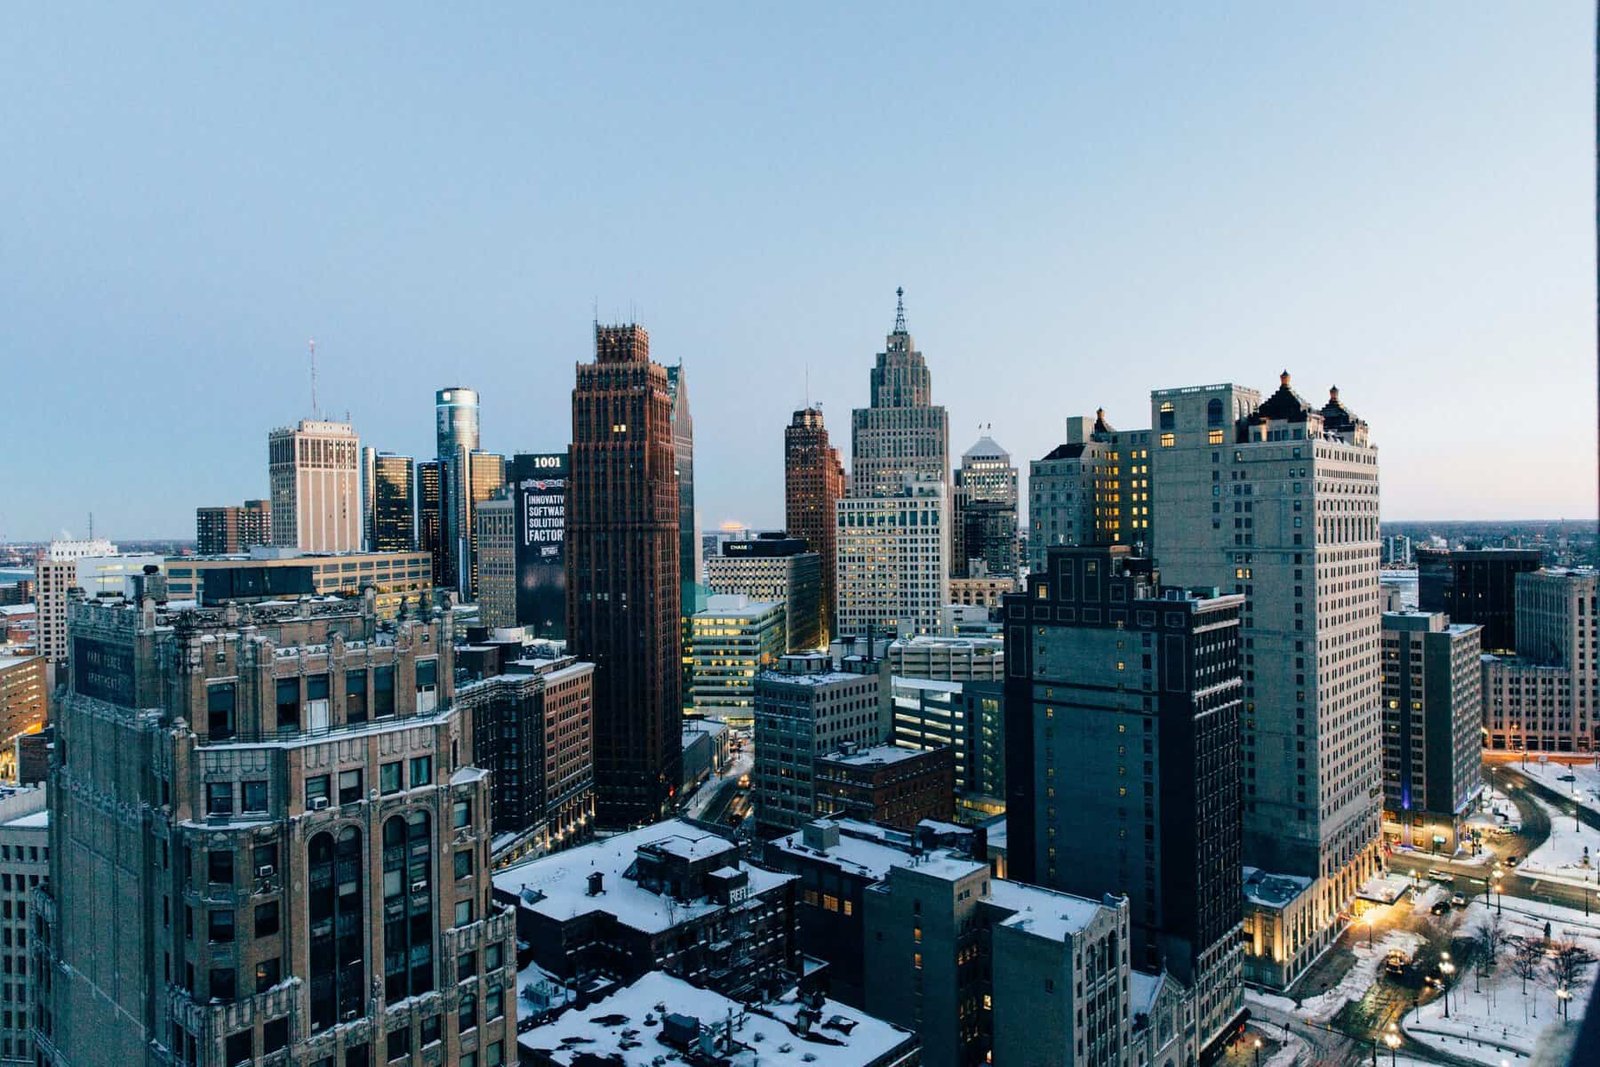
The most affordable metro for buying a high-end home is Detroit, MI where the median sale price for a luxury home was $719,252 in May—47.7% less than the typical luxury home nationwide.
That’s according to a Redfin analysis of home-sale price-tier data for the three months ending May 31, 2026. Luxury homes are defined as those estimated to be in the top 5% of their respective metro area based on prices of homes sold over a rolling 12-month period.
“The Detroit area has a lot of beautiful, high-end homes that are affordable here, but would cost millions of dollars if they were in a major coastal metro area,” Anne Loehr, Redfin Principal Agent, said. “I don’t know how long it will last, especially as we see more people moving here from the coasts.”
Detroit, Cleveland, Pittsburgh, Cincinnati and San Antonio Are the Only Major Metros Where the Median Luxury Home Costs Less Than $1 Million
“Luxury home prices have continued to climb because wealthy buyers tend to be less constrained by mortgage rates and more focused on finding the right property. The fact that only five major metros still offer a typical luxury home for under $1 million shows just how much the high-end market has appreciated in recent years. For buyers looking to break into the luxury segment, those markets remain some of the few places where a seven-figure budget isn’t yet the price of admission,” Yingqi Xu, Redfin Senior Economist, said.
Luxury Prices in Indianapolis, St. Louis and Columbus Cross the $1 Million Mark
Fast home price growth pushed Indianapolis and St. Louis across the $1 million threshold, having seen high-end home prices rise 9% and 10.9%, respectively, over the past year. The typical luxury home in Indianapolis now costs $1,009,314; in St. Louis, it costs $1,028,596.
In Columbus, luxury home prices grew at a slower pace, up 2.9% year over year, reaching $1,017,342 in May.
Nationwide, the median luxury home sale price is $1,374,470, up 4.7% from last year.
The 5 Major U.S. Metros Where You Can Still Buy a Luxury Home For Less Than $1 Million, May 2026
| Ranking | Metro area | Luxury median home sale price (2026) | Luxury median home sale price (YoY) |
| 1. | Detroit, MI | $719,252 | -1.0% |
| 2. | Cleveland, OH | $833,228 | 11% |
| 3. | Pittsburgh, PA | $904,202 | 6.1% |
| 4. | Cincinnati, OH | $952,523 | 0.3% |
| 5. | San Antonio, TX | $968,344 | 5.1% |
| This report is based on a Redfin analysis of MLS data that is subject to revision. All figures cover a three month period ending in May 2026. Redfin defines luxury homes as those estimated to be in the top 5% of their metro area’s price range. | |||
California and Florida Dominate the Nation’s Most Expensive Luxury Housing Markets
San Francisco remains the priciest major metro, with the typical luxury home selling for roughly $6.6 million during the three months ending May. Anaheim ($5.3 million), Miami ($4.9 million), Los Angeles ($4.5 million) and West Palm Beach ($4.51 million) round out the five most expensive luxury markets.
The 5 Major U.S. Metros With the Most Expensive Luxury Homes, May 2026
| Ranking | Metro area | Luxury median home sale price (2026) | Luxury median home sale price (YoY) |
| 1. | San Francisco, CA | $6,648,922 | 6% |
| 2. | Anaheim, CA | $5,276,971 | 2.2% |
| 3. | Miami, FL | $4,855,331 | 14.2% |
| 4. | Los Angeles, CA | $4,512,482 | 4.9% |
| 5. | West Palm Beach, FL | $4,510,196 | 1.3% |
| This report is based on a Redfin analysis of MLS data that is subject to revision. All figures cover a three month period ending in May 2026. Redfin defines luxury homes as those estimated to be in the top 5% of their metro area’s price range. | |||
The divide between luxury and non-luxury home prices continues to widen in many metros.
Luxury homes in West Palm Beach, FL sold for a median sale price of $4.5 million, nearly nine times more costly than the typical non-luxury home.
The South Florida metro has the biggest luxury home price premium among the 49 most populous U.S. housing markets, followed closely by neighboring Miami. In Miami, the typical luxury home sale price was $4,855,311, up 14.2% year over year, the largest increase among the five most expensive luxury markets.
Luxury Housing Price Growth by Metro Area
| Metro Area | Median sale price: luxury | Luxury median home sale price (YoY) |
| Anaheim, CA | $5,276,971 | 2.2% |
| Atlanta, GA | $1,440,533 | 6.4% |
| Austin, TX | $1,811,150 | 9.0% |
| Baltimore, MD | $1,276,125 | 4.0% |
| Boston, MA | $2,826,655 | 7.4% |
| Charlotte, NC | $1,660,462 | 4.7% |
| Chicago, IL | $1,545,360 | 6.2% |
| Cincinnati, OH | $952,523 | 0.3% |
| Cleveland, OH | $833,228 | 11.0% |
| Columbus, OH | $1,017,342 | 2.9% |
| Dallas, TX | $1,603,312 | -0.3% |
| Denver, CO | $1,971,456 | 4.3% |
| Detroit, MI | $719,252 | -1.0% |
| Fort Worth, TX | $1,309,293 | 9.4% |
| Houston, TX | $1,361,843 | 4.9% |
| Indianapolis, IN | $1,009,314 | 9.0% |
| Jacksonville, FL | $1,589,567 | 6.9% |
| Kansas City, MO | $1,137,946 | 10.9% |
| Las Vegas, NV | $1,694,567 | 13.7% |
| Los Angeles, CA | $4,512,482 | 4.9% |
| Miami, FL | $4,855,331 | 14.2% |
| Milwaukee, WI | $1,098,057 | 8.9% |
| Minneapolis, MN | $1,284,400 | 8.1% |
| Montgomery County, PA | $1,544,219 | 8.5% |
| Nashville, TN | $2,190,591 | 7.1% |
| Nassau County, NY | $2,862,605 | 13.3% |
| New Brunswick, NJ | $1,947,027 | -4.3% |
| New York, NY | $4,380,249 | 5.0% |
| Newark, NJ | $2,126,234 | 7.9% |
| Oakland, CA | $2,999,012 | -1.8% |
| Orlando, FL | $1,437,130 | 4.5% |
| Philadelphia, PA | $1,342,284 | 11.1% |
| Phoenix, AZ | $2,225,630 | 12.6% |
| Pittsburgh, PA | $904,202 | 6.1% |
| Portland, OR | $1,459,821 | 2.0% |
| Providence, RI | $1,714,243 | 6.3% |
| Riverside, CA | $1,723,962 | 0.5% |
| Sacramento, CA | $1,721,234 | 2.8% |
| San Antonio, TX | $968,344 | 5.1% |
| San Diego, CA | $3,771,304 | 2.7% |
| San Francisco, CA | $6,648,922 | 6.0% |
| San Jose, CA | $5,654,565 | 4.4% |
| Seattle, WA | $2,992,812 | 3.1% |
| St. Louis, MO | $1,028,596 | 10.9% |
| Tampa, FL | $1,650,875 | 15.6% |
| Virginia Beach, VA | $1,105,952 | 9.5% |
| Warren, MI | $1,052,067 | 4.5% |
| Washington, DC | $2,040,078 | 3.0% |
| West Palm Beach, FL | $4,510,196 | 1.3% |
| National | $1,374,470 | 4.7% |
Methodology
This report is based on a Redfin analysis of MLS data that is subject to revision. All figures cover a three month period ending in May 2026. Redfin defines luxury homes as those estimated to be in the top 5% of their metro area’s price range, while non-luxury homes fall into the 35th-65th percentile. This report covers 49 of the most populous areas for which Redfin has data.